我们让 华为 P60 Pro 通过我们严格的 DXOMARK 相机测试套件,从最终用户的角度衡量其在照片、视频和变焦质量方面的表现。本文分解了该设备在各种测试和几个常见的使用案例中的表现,并旨在通过对捕获数据的分析来强调我们测试中最重要的结果。
概述
摄像头主要规格:
- 主摄像头:4800 万像素 RYYB 传感器、等效 24.5毫米f/1.4 – f/4.0自动可调物理光圈镜头、自动对焦、光学图像防抖技术
- 超广角:1300万像素传感器、等效 13 毫米 f/2.2 光圈镜头、自动对焦
- 远摄:4800万像素传感器、等效90 毫米f/2.1 光圈镜头、自动对焦、最近对焦距离10厘米
- 芯片组:骁龙 8+ Gen 1 4G
评分
包含了总分及子分数和属性

Huawei P60 Pro
用例&拍摄条件
用例的分数表明产品在特定情况下的表现。它们不包括在总分的计算中。
户外拍摄
明亮光线下 (≥1000 勒克斯)拍摄照片和视频
室内拍摄
明亮光线下 (≥1000 勒克斯)拍摄照片和视频
低光拍摄
低光条件下(100 勒克斯以下)拍摄照片和视频
人像
人像和团体照片及视频
优点
- 风景或人像图像的动态范围宽广,各种光照条件下的对比度都很不错
- 在每种测试光源下所拍摄的照片都呈现出漂亮且生动的色彩;在户外和室内所录制的视频色彩良好
- 照片模式下自动对焦快速准确
- 团体照中所有位于不同平面的主体脸部都呈现出良好的景深及清晰度
- 照片、视频和变焦时的细节多且噪点控制得宜
- 人像模式下的模糊效果佳且主体隔离准确
不足
- 低光下的视频肤色不自然
- 在棘手的条件下会呈现出一些不自然的细节
- 视频转换期间会出现对焦的步进痕迹
- 图像有伪像,包括耀斑、量化和振铃效应
华为 P60 Pro 在 DXOMARK 摄像头评比中拿下冠军宝座,这可归功于主摄像头在大部份变焦设置下都能拍摄出质量一流的静态图像。视频部份,华为在防抖、色彩和纹理呈现方面都比前一款机种明显有所进步,非常接近oppo Find X6 Pro 和苹果 iPhone 14 Pro 的性能。
华为卓然出众的表现是基于其创新的图像硬件和软件。P60 Pro 并不是第一款配置了可调光圈的智能手机,但就如此大的传感器而言,它是少数提供光圈范围为f/1.4 至 f/4的机种之一。之前发布的华为 Mate 50 Pro 也装设了可变光圈,但传感器略小(1/1.56 英寸)。光圈会依据光照条件和场景内容自动调整。举例来说,低光下拍摄照片会调大光圈;拍摄集体照时,则会缩小以增加景深并确保所有被拍摄的主体都能有良好的清晰度。在我们的测试中,这有助于曝光和对焦。其他静态图像的质量在各项目的评测中表现的也是可圈可点,在大多数的条件下都展现出准确且令人赏心悦目的色彩,自动对焦也很快速精准,纹理/噪点间的取舍也调校的不错。
在超高端机种中,P60 Pro 的远摄摄像头所配置的图像传感器并不是最大的,但相较于一些装置了较大传感器的竞争对手,由于其快速的 f/2.1 光圈,这款摄像头还是可以聚集较多的光线。通过全面的影像融合解决方案,结合主摄像头和远摄摄像头所拍摄的图像信息,对远摄变焦的纹理进行优化,而这些融合算法适用于各种用例和光照条件。
相较于之前的机种,P60 Pro 在视频方面进行了一些重要的改进,而凭借着内部视频 HDR 解决方案(HDR Vivid),华为的表现几近完美,这款最新的品牌旗舰机也成为目前智能手机视频评比的第三名,仅次于苹果 iPhone 14 Pro与 OPPO 的 Find X6 Pro。在我们的测试中,P60 Pro 在所有条件下所录制的影片都展现出良好的曝光度和宽广的动态范围。色彩呈现也很好,防抖系统在抵消相机抖动方面处理的相当不错。纹理、噪点和自动对焦也很出色,不过,与其他视频质量的属性相比,还是有许多可改进的空间。
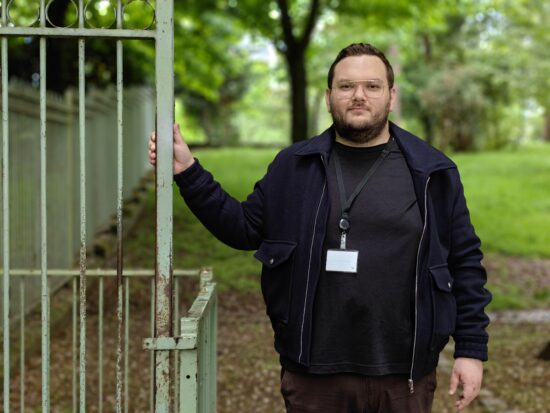
由于超广角和远摄摄像头都可以使用微距模式,因此,华为也是近距拍摄时的最佳选择,而Mate 50 Pro+ 也具备了这项功能。两个摄像头都具备微距功能的好处是在各种拍摄距离下都能进行微距拍摄,也让摄影师与被拍摄的主体能保持一定距离,这在拍摄生物时是很重要的。在我们进行 P60 Pro 的测试时,远摄摄像头的微距功能呈现出类似 DSLR 的景深。人像模式的性能相当于同类机种中表现最佳的手机,展现出自然的渲染效果、准确的主体隔离以及良好的模糊渐变。请注意,DXOMARK 仅测试一种模式(最佳的一种),因此这些额外的功能并不会影响近摄的分数。华为P60 Pro是在AI关闭的默认模式下进行测试的。
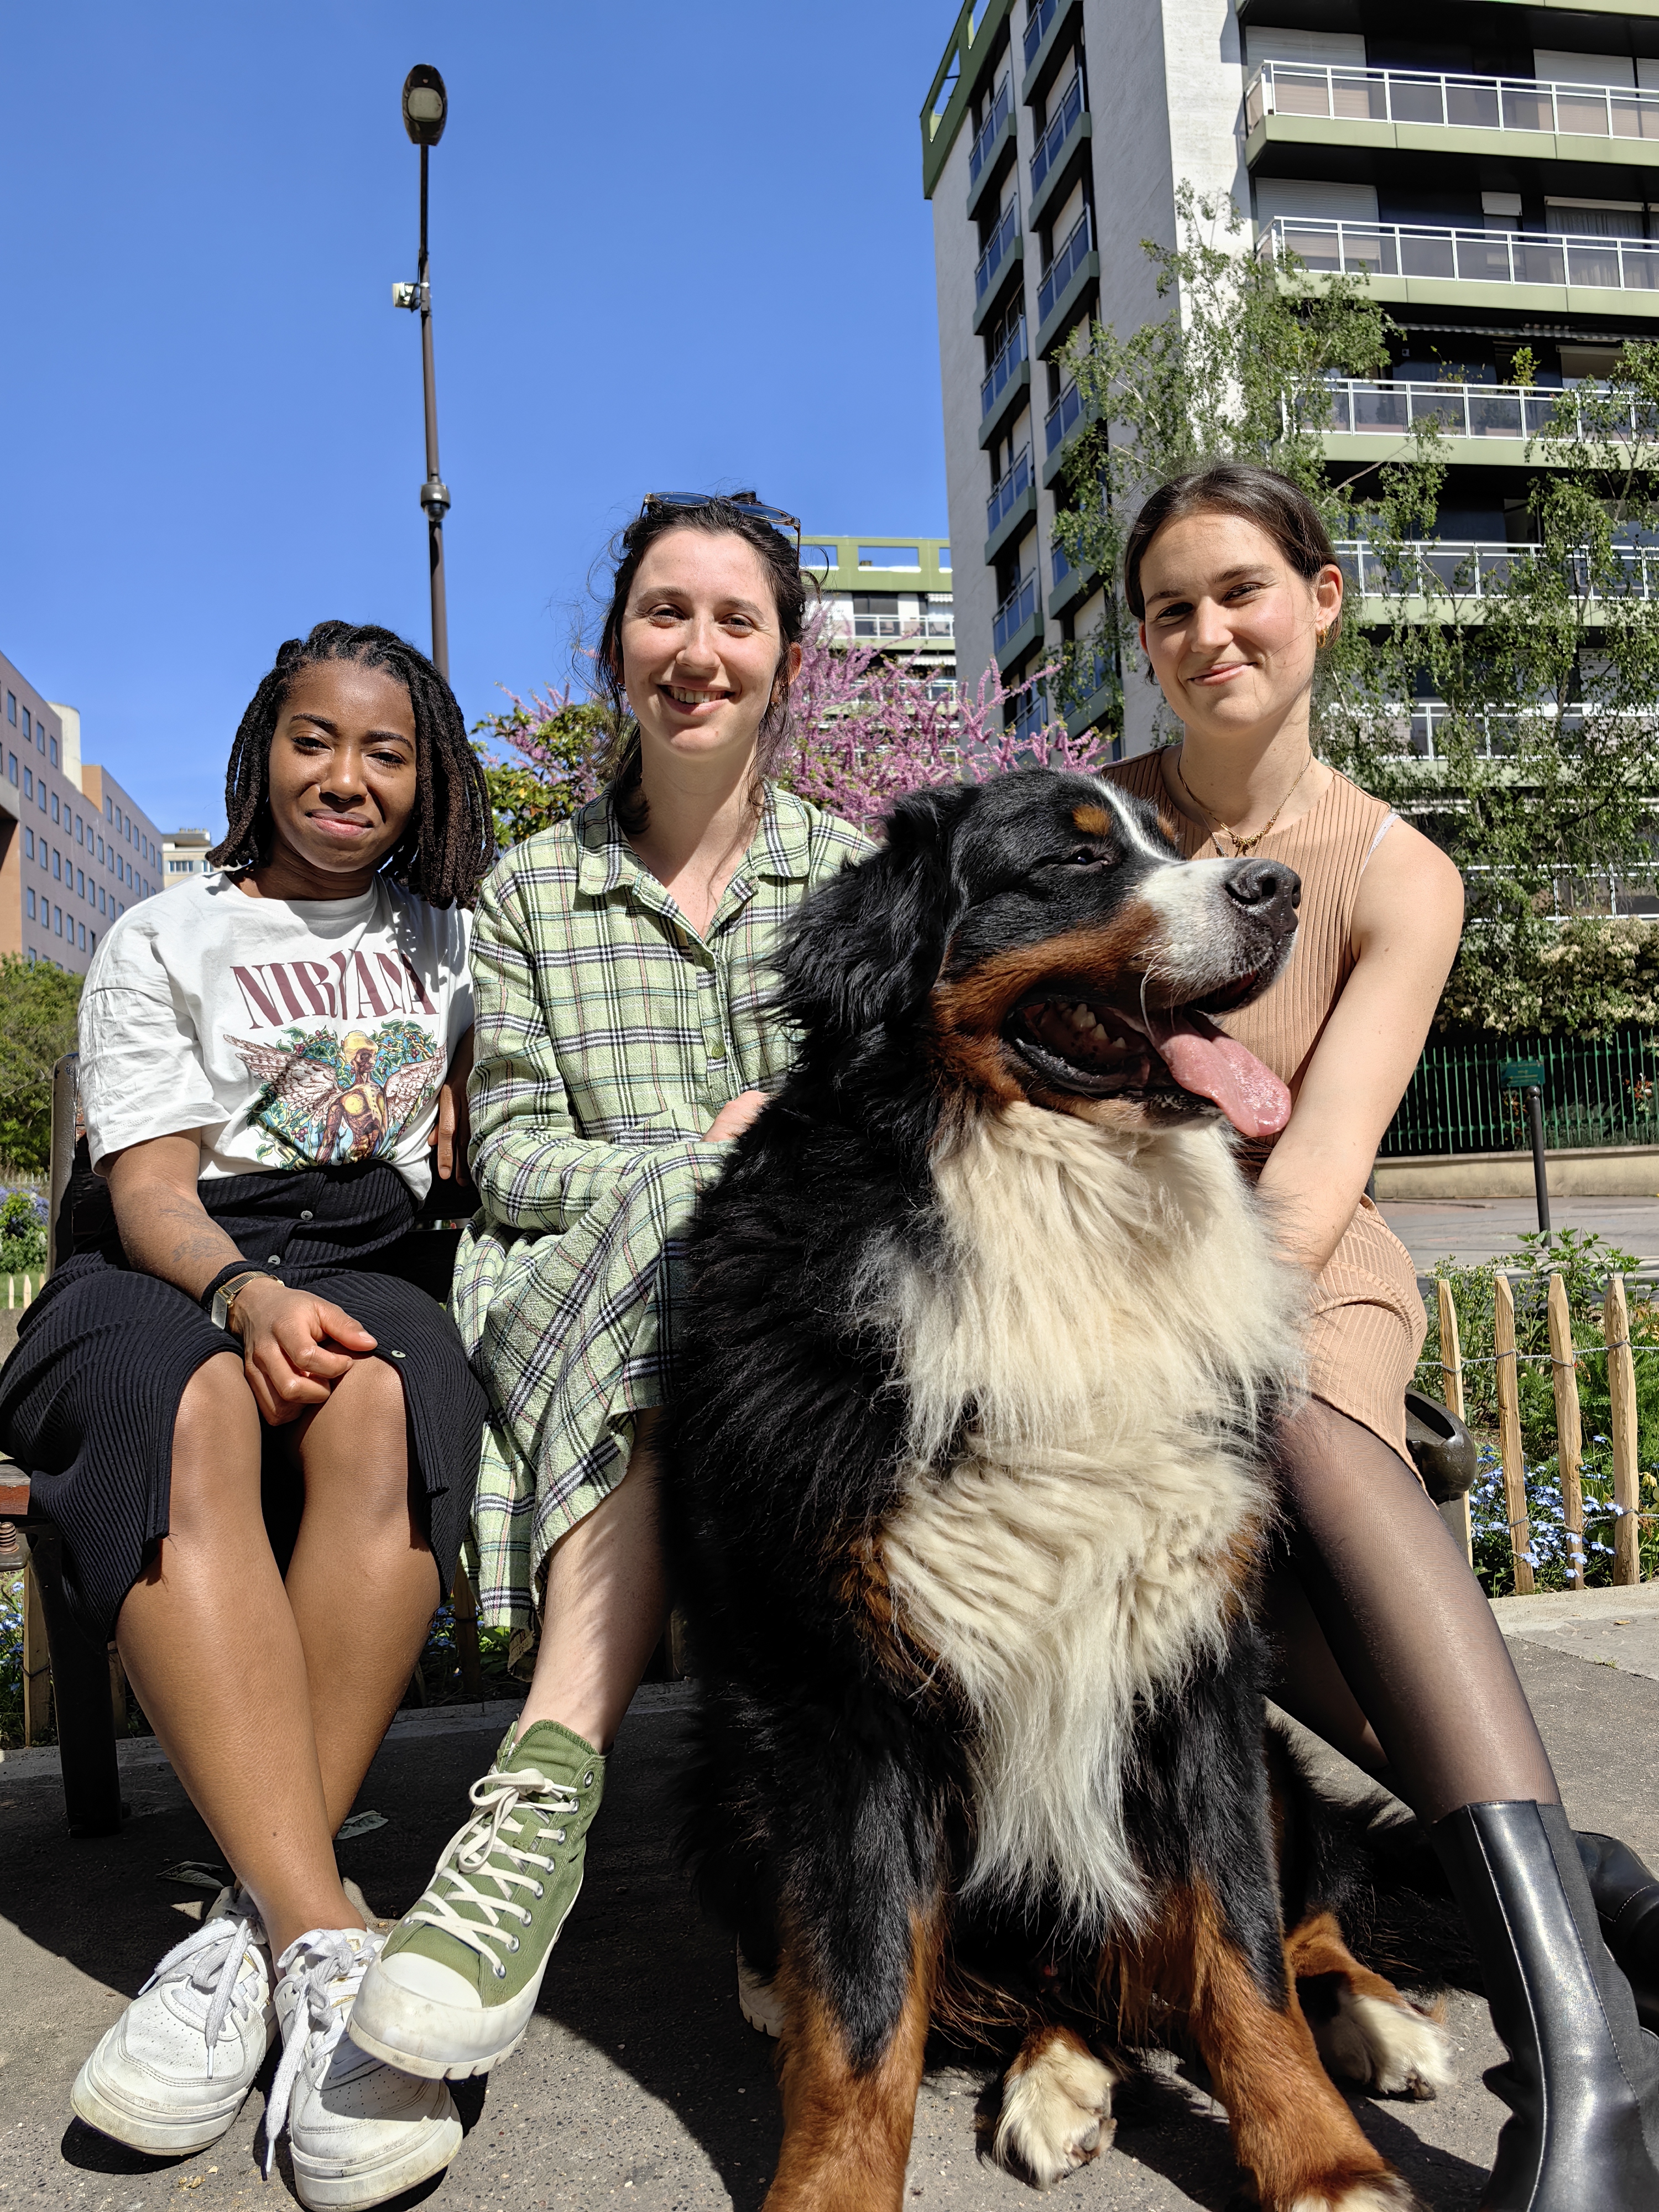
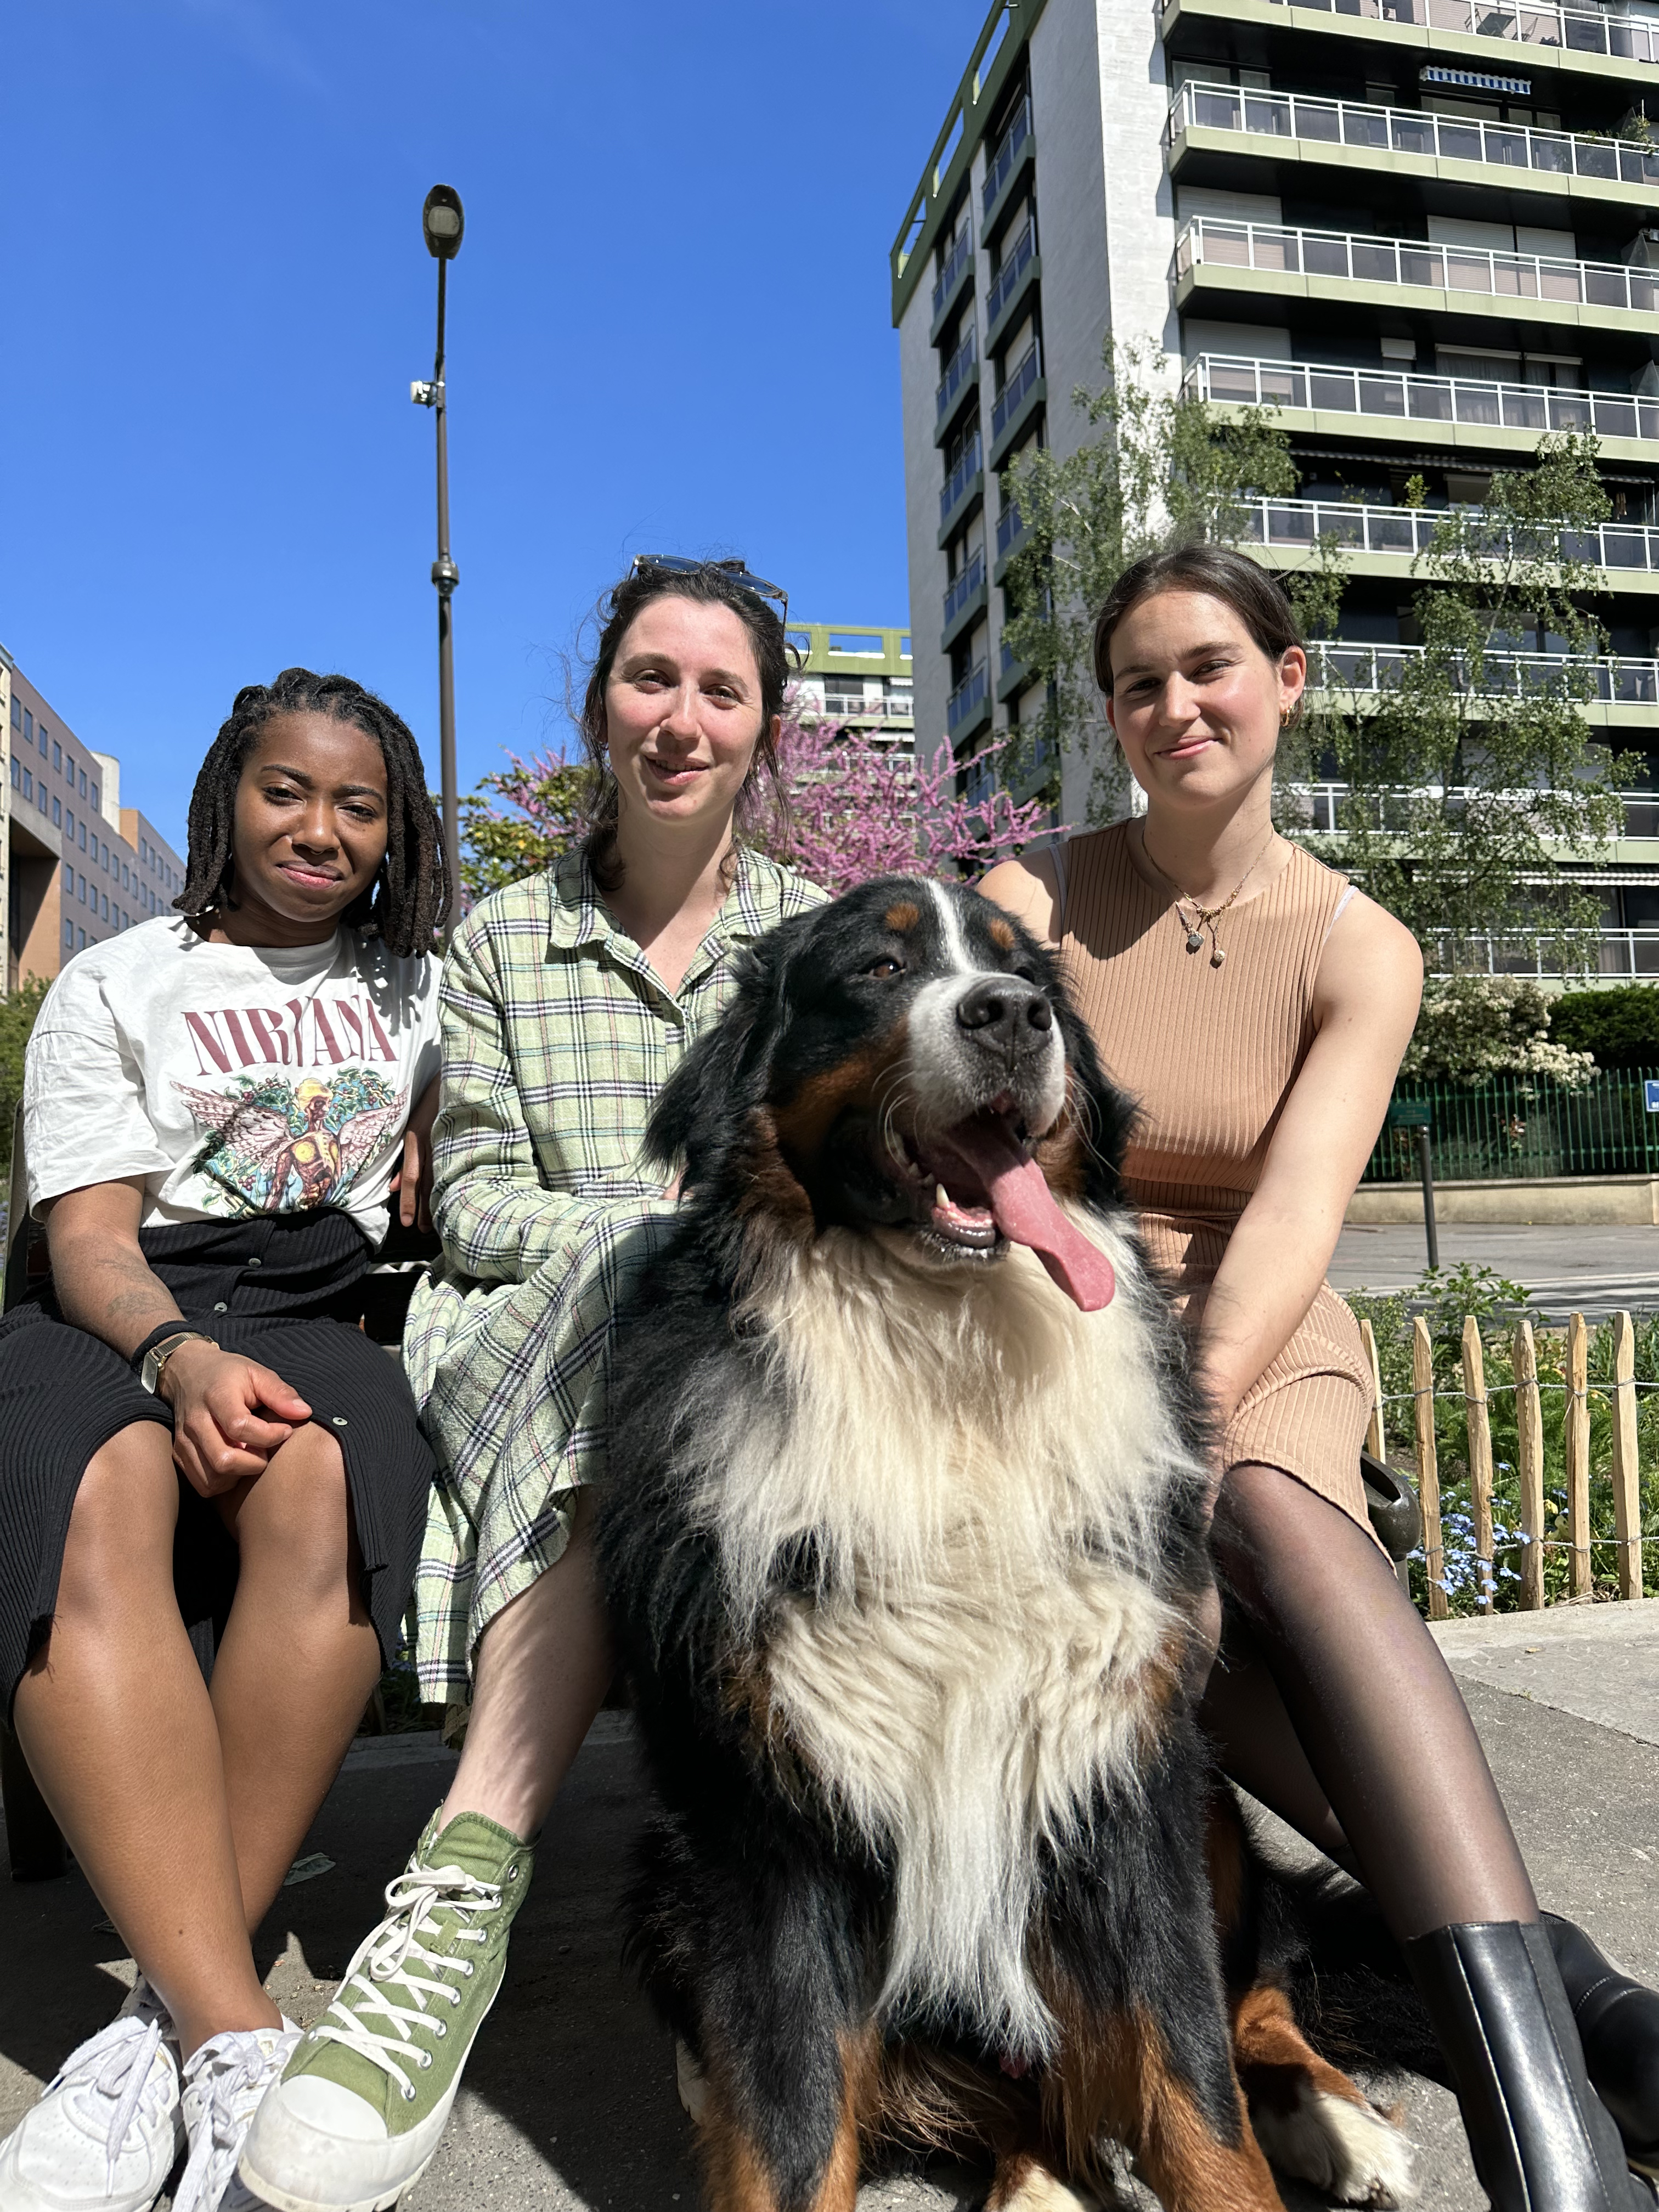
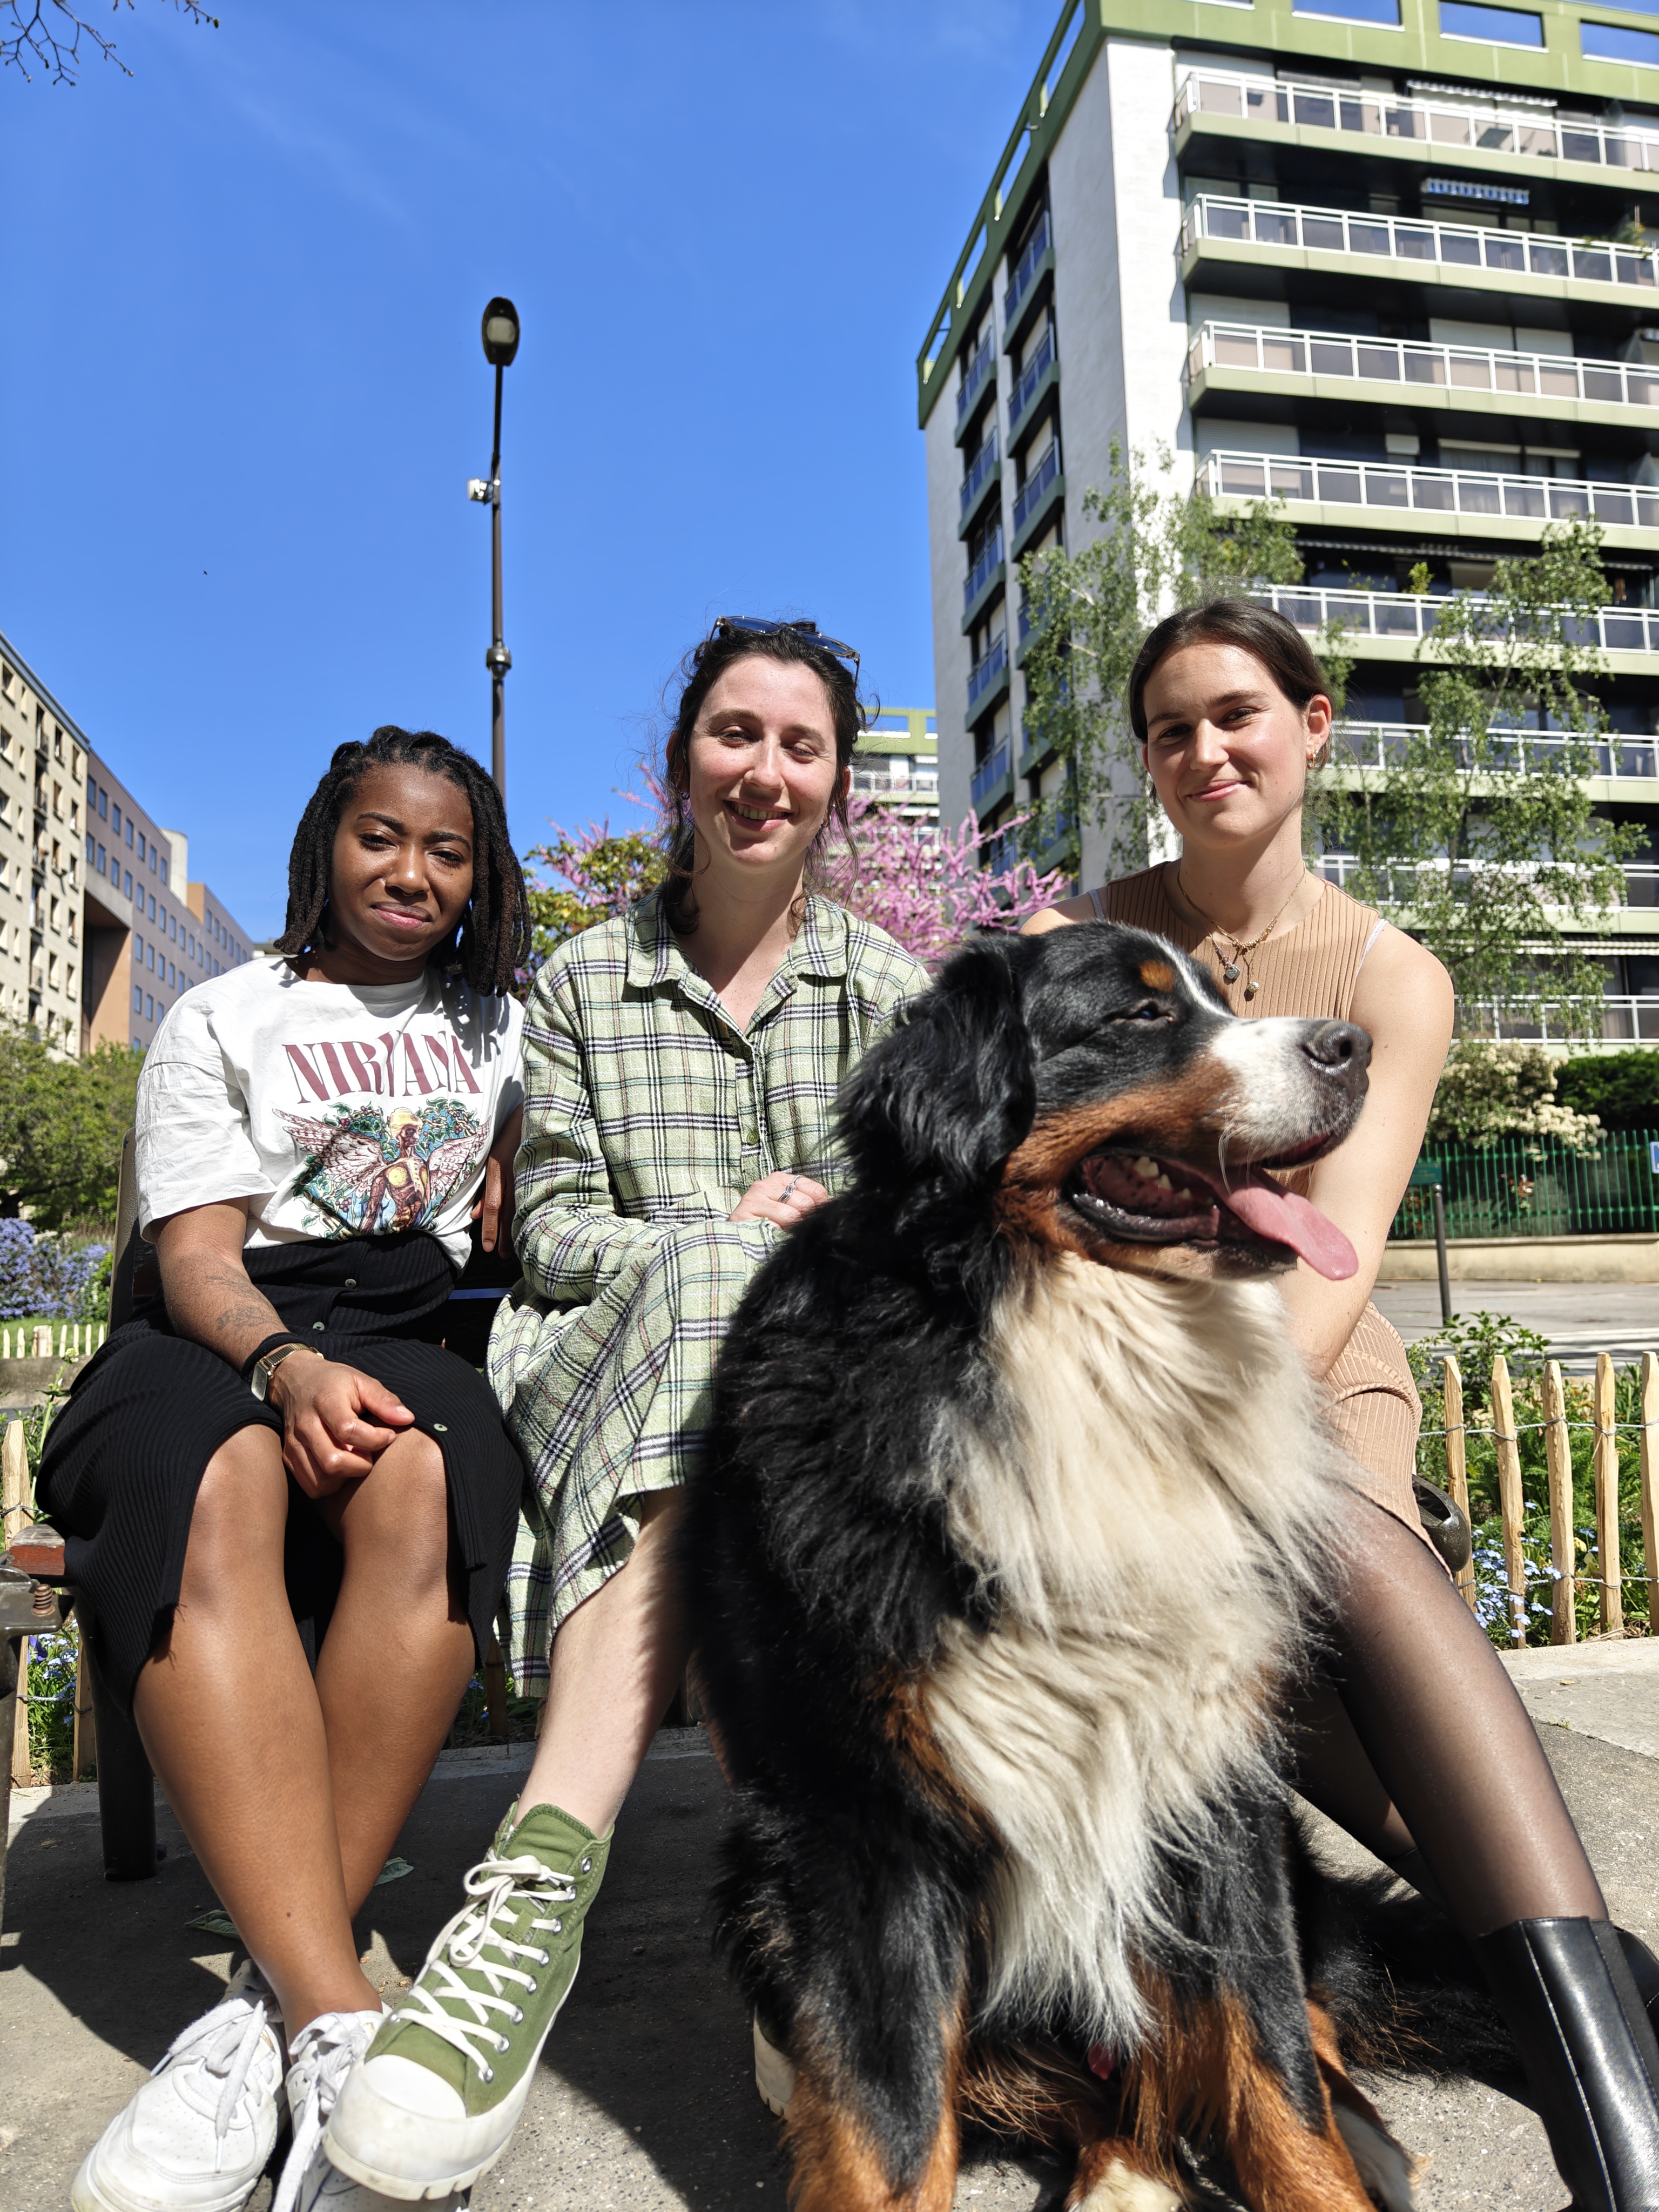
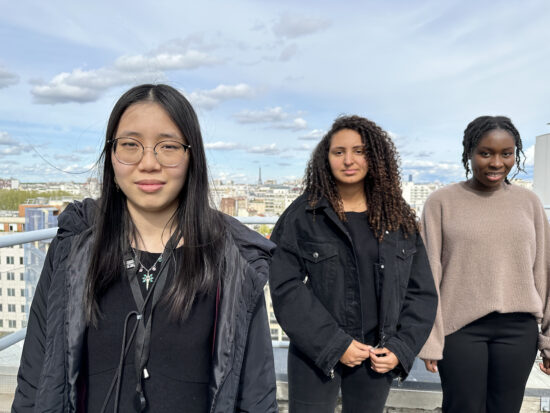
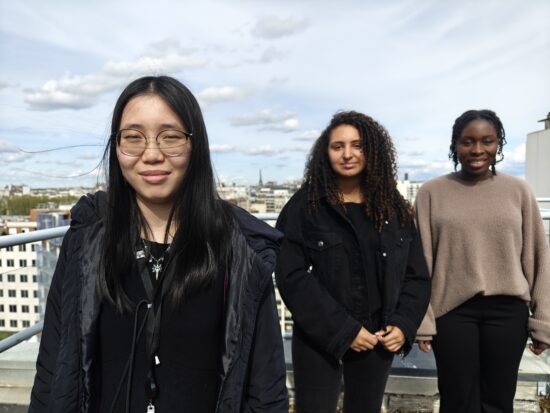
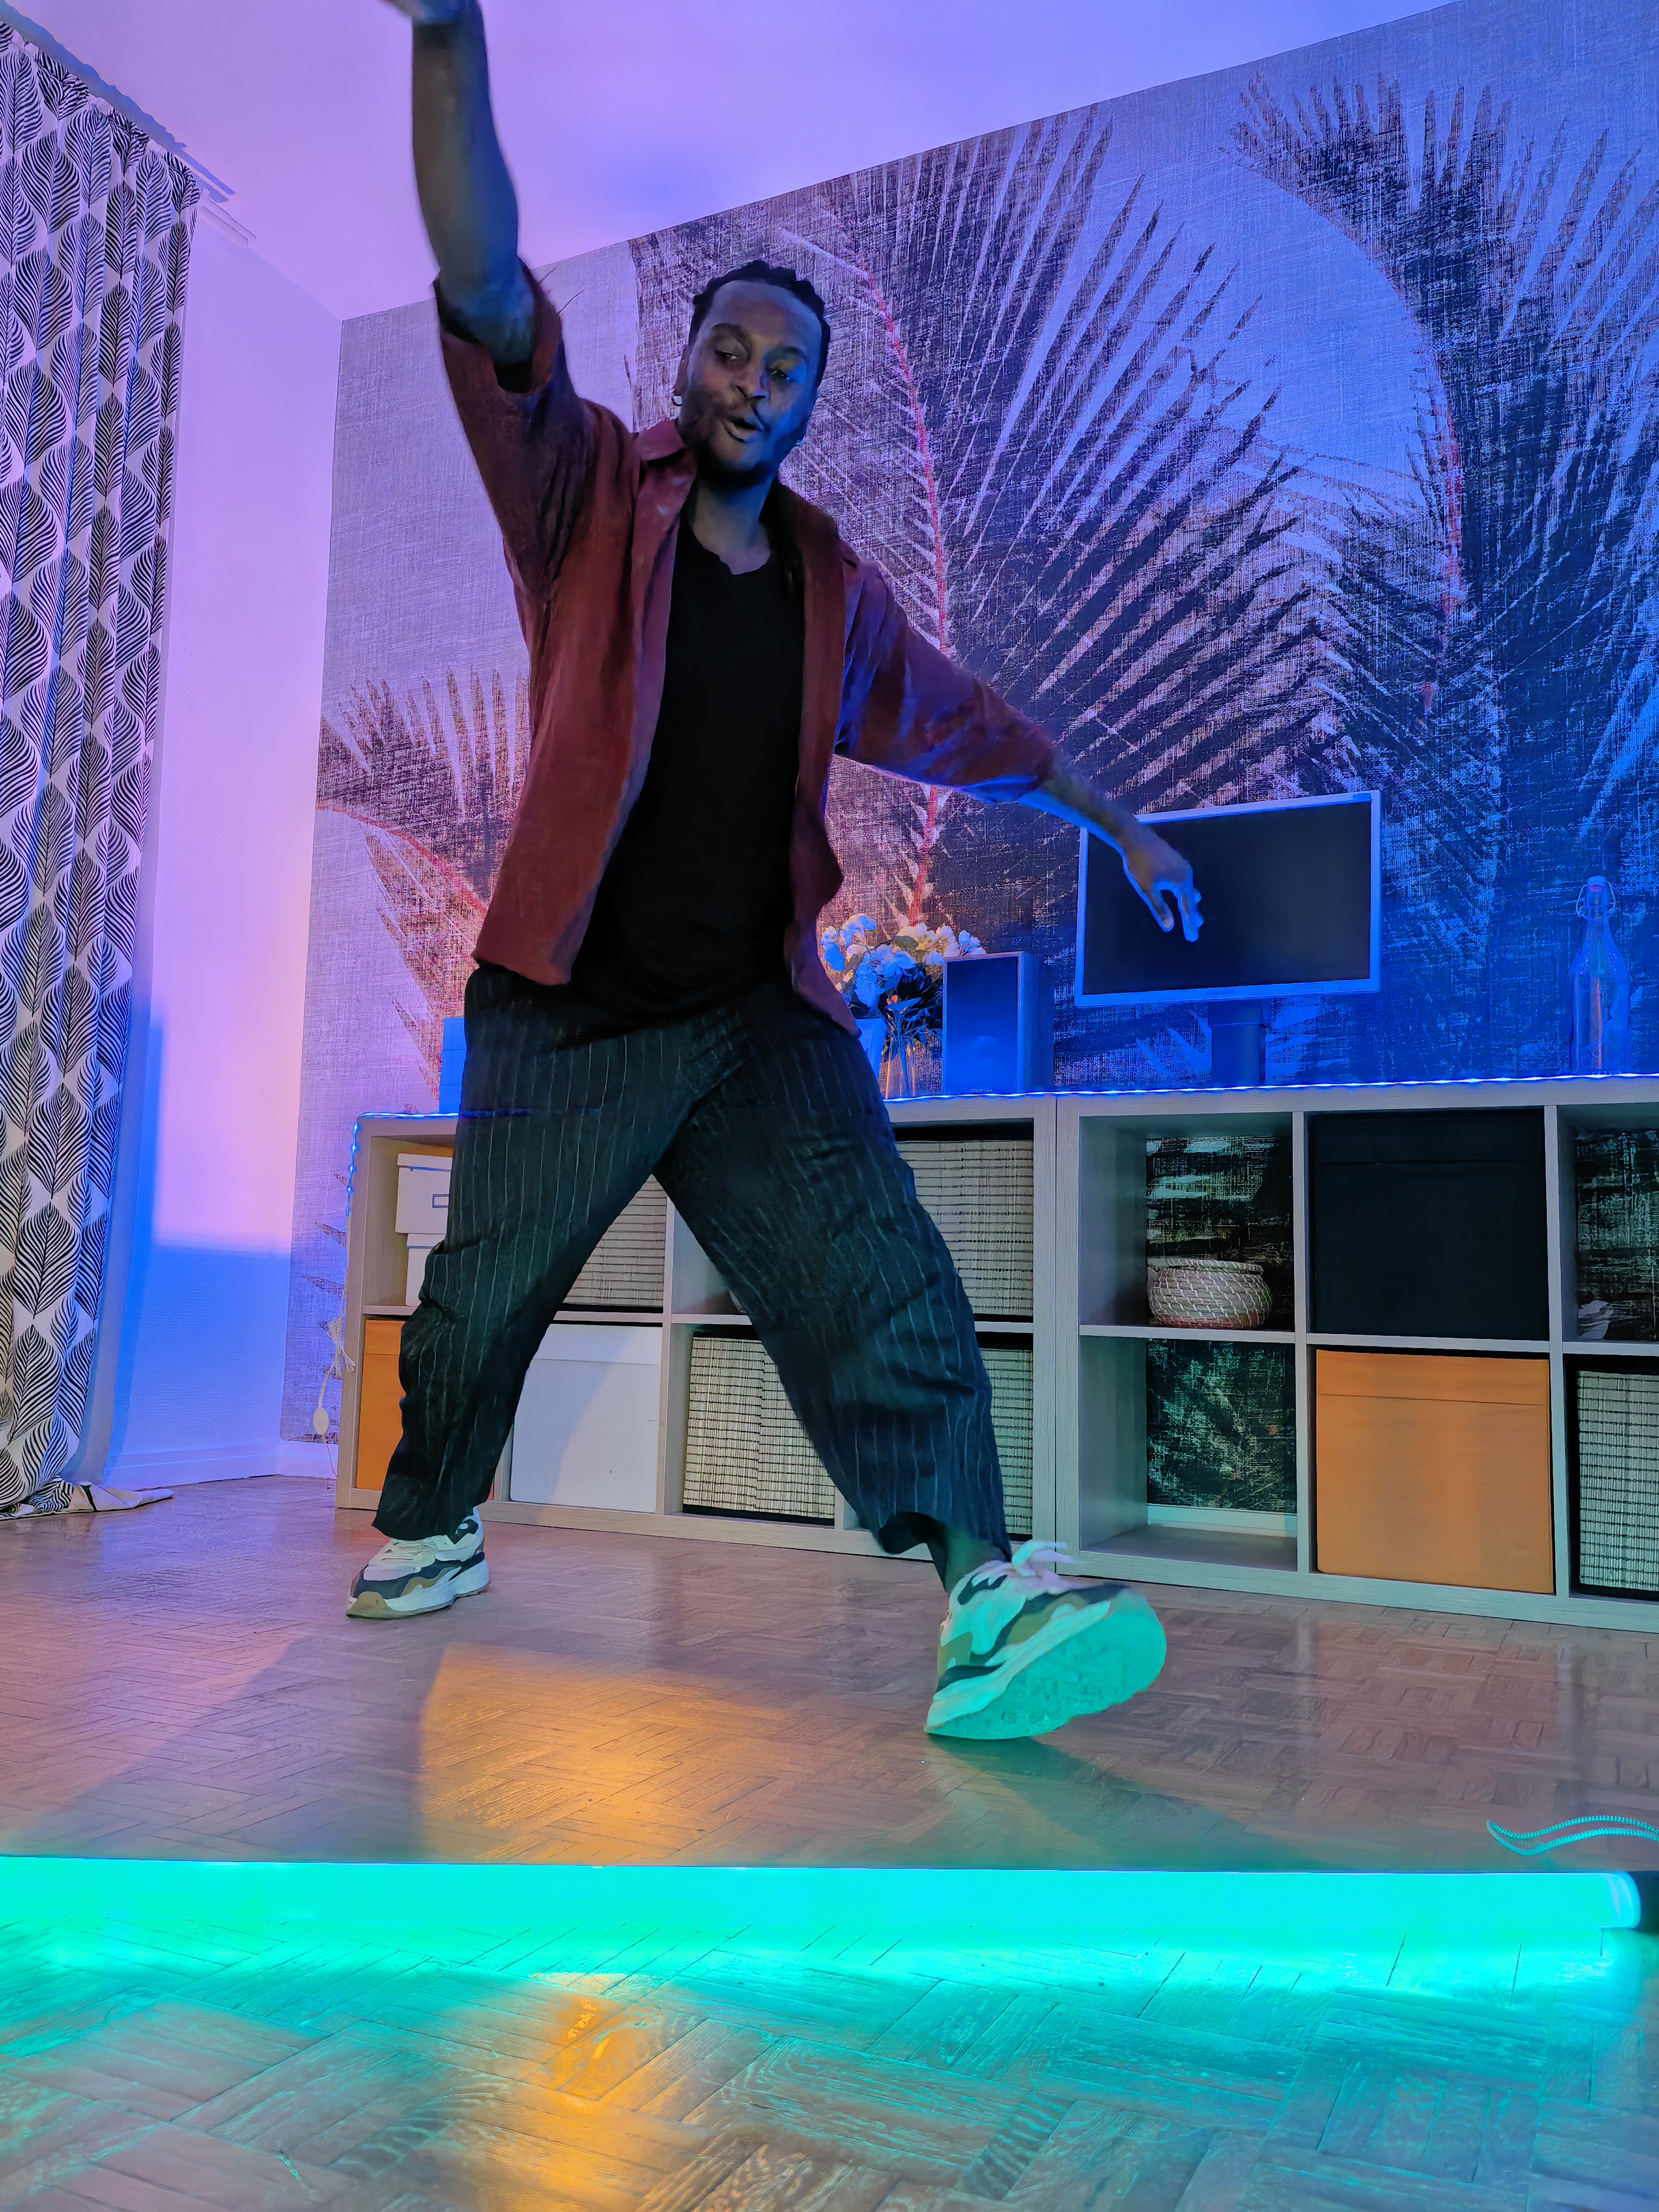
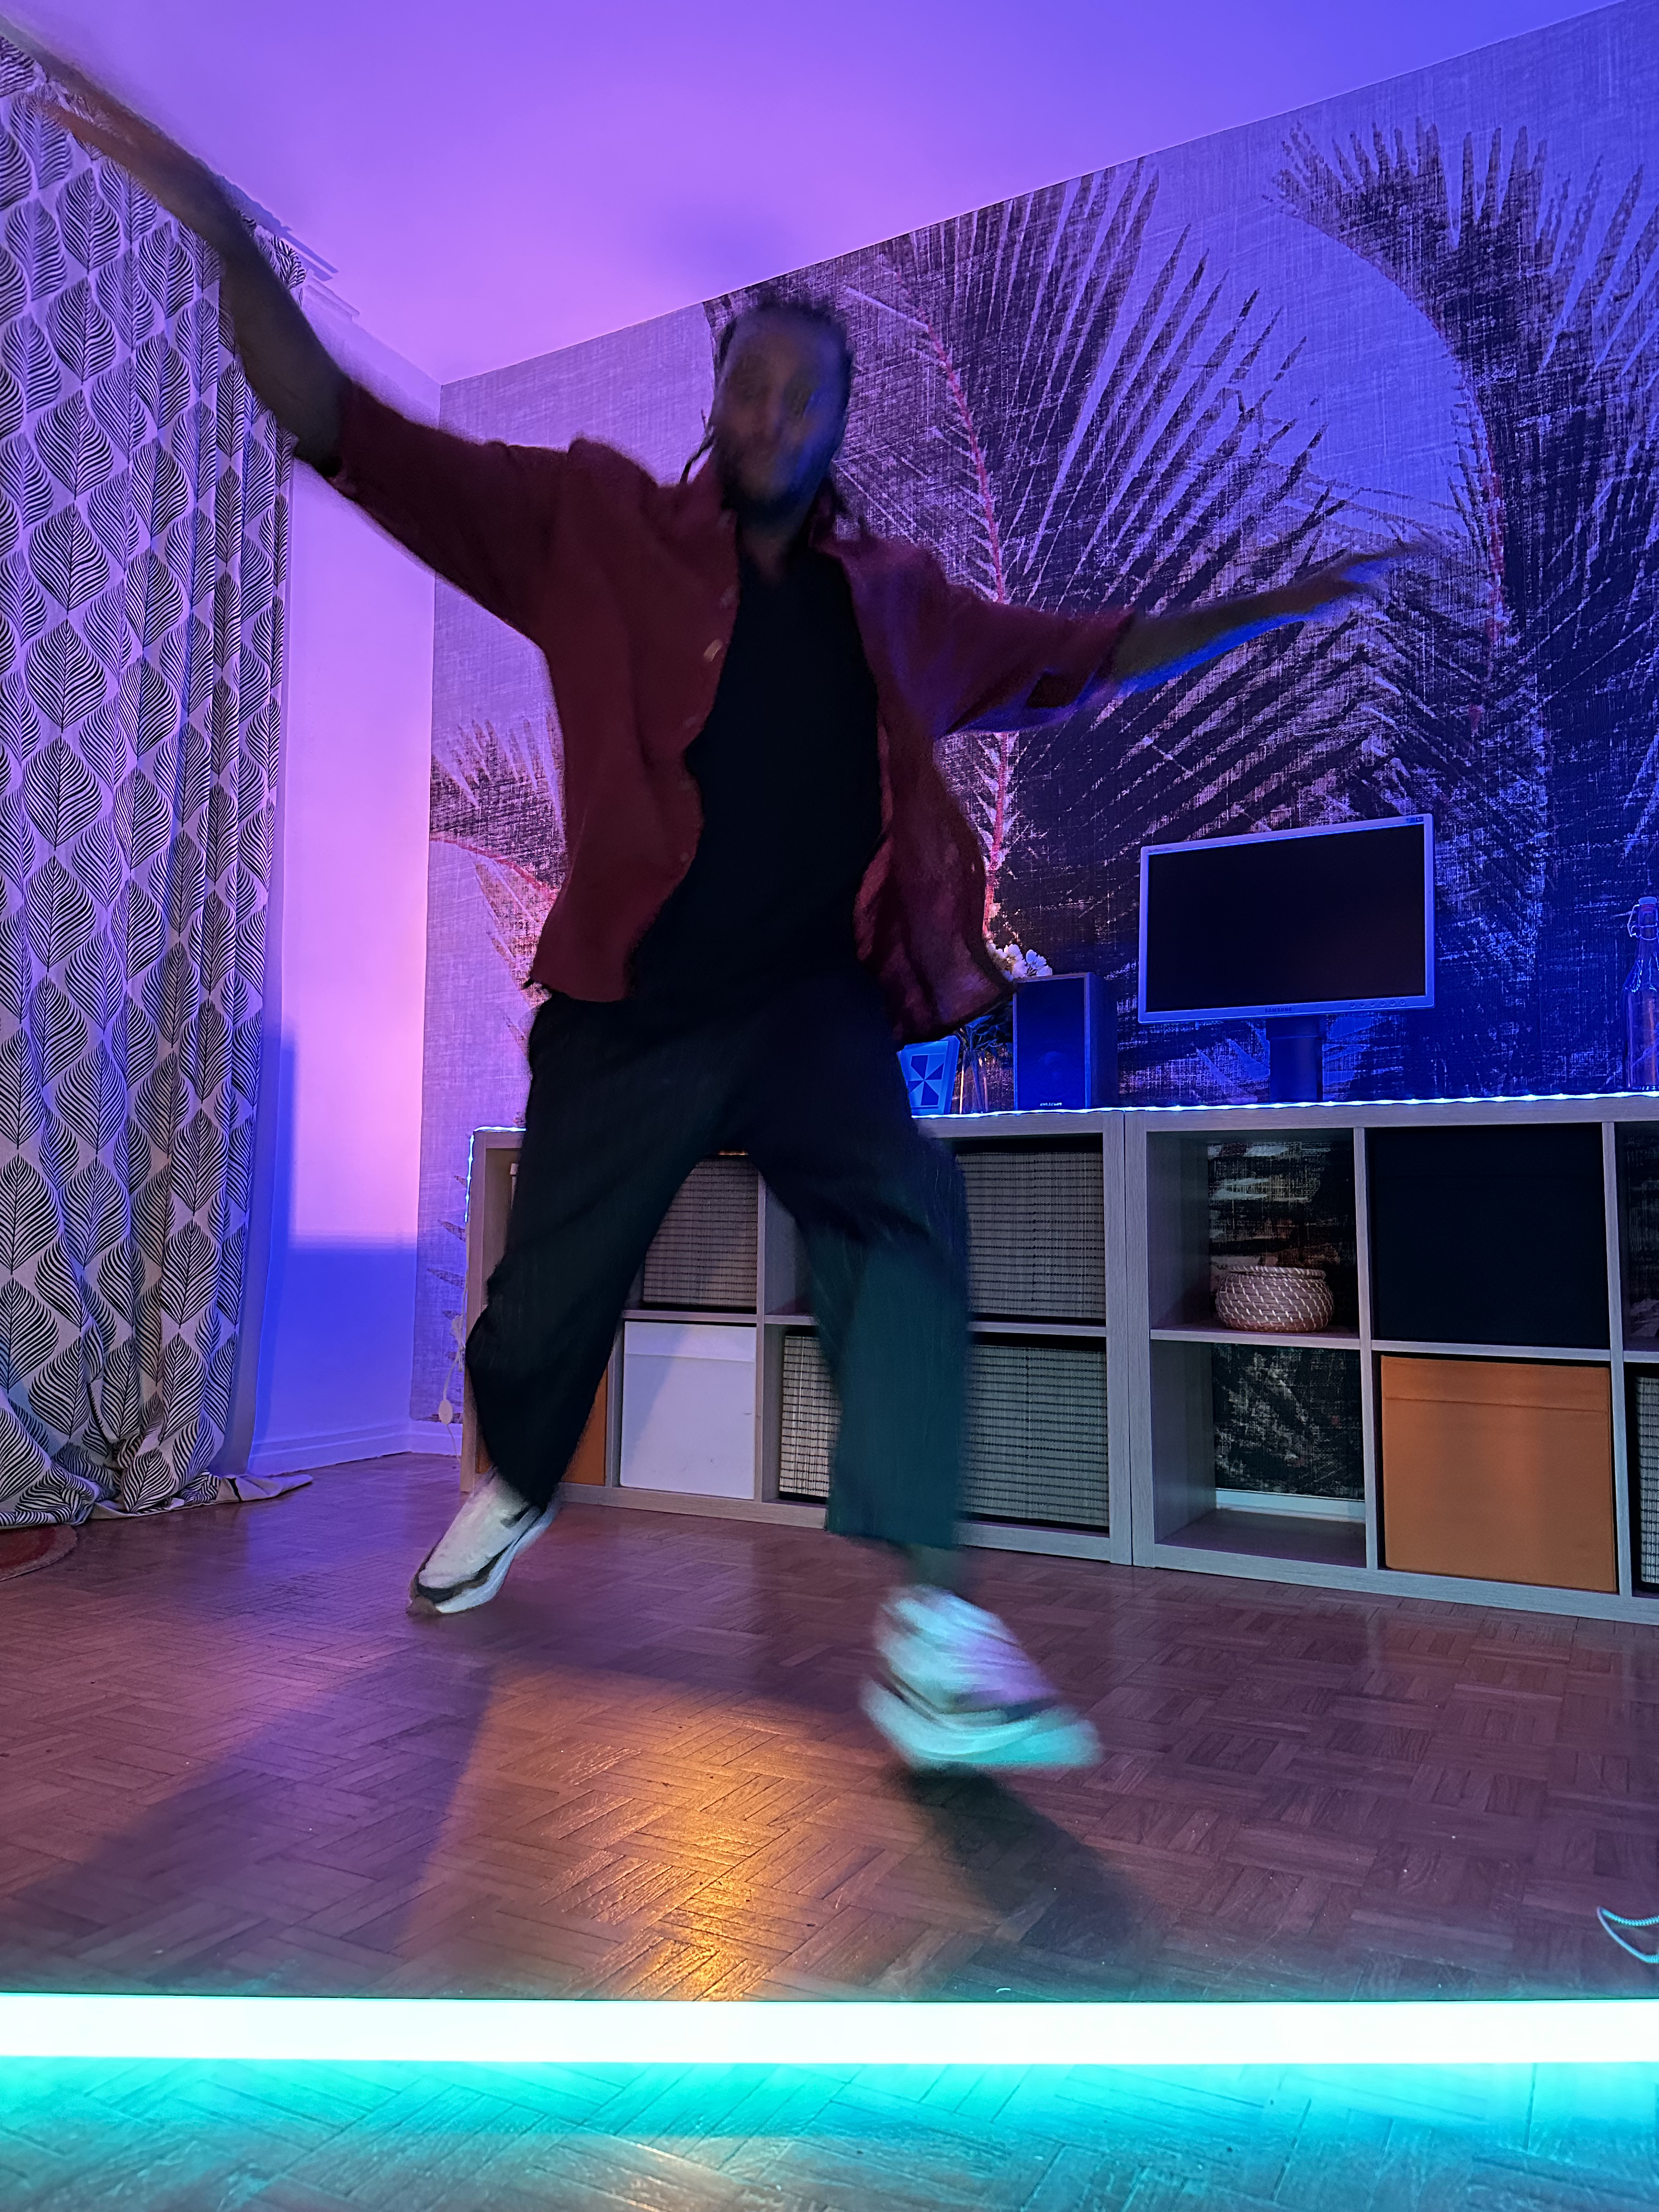
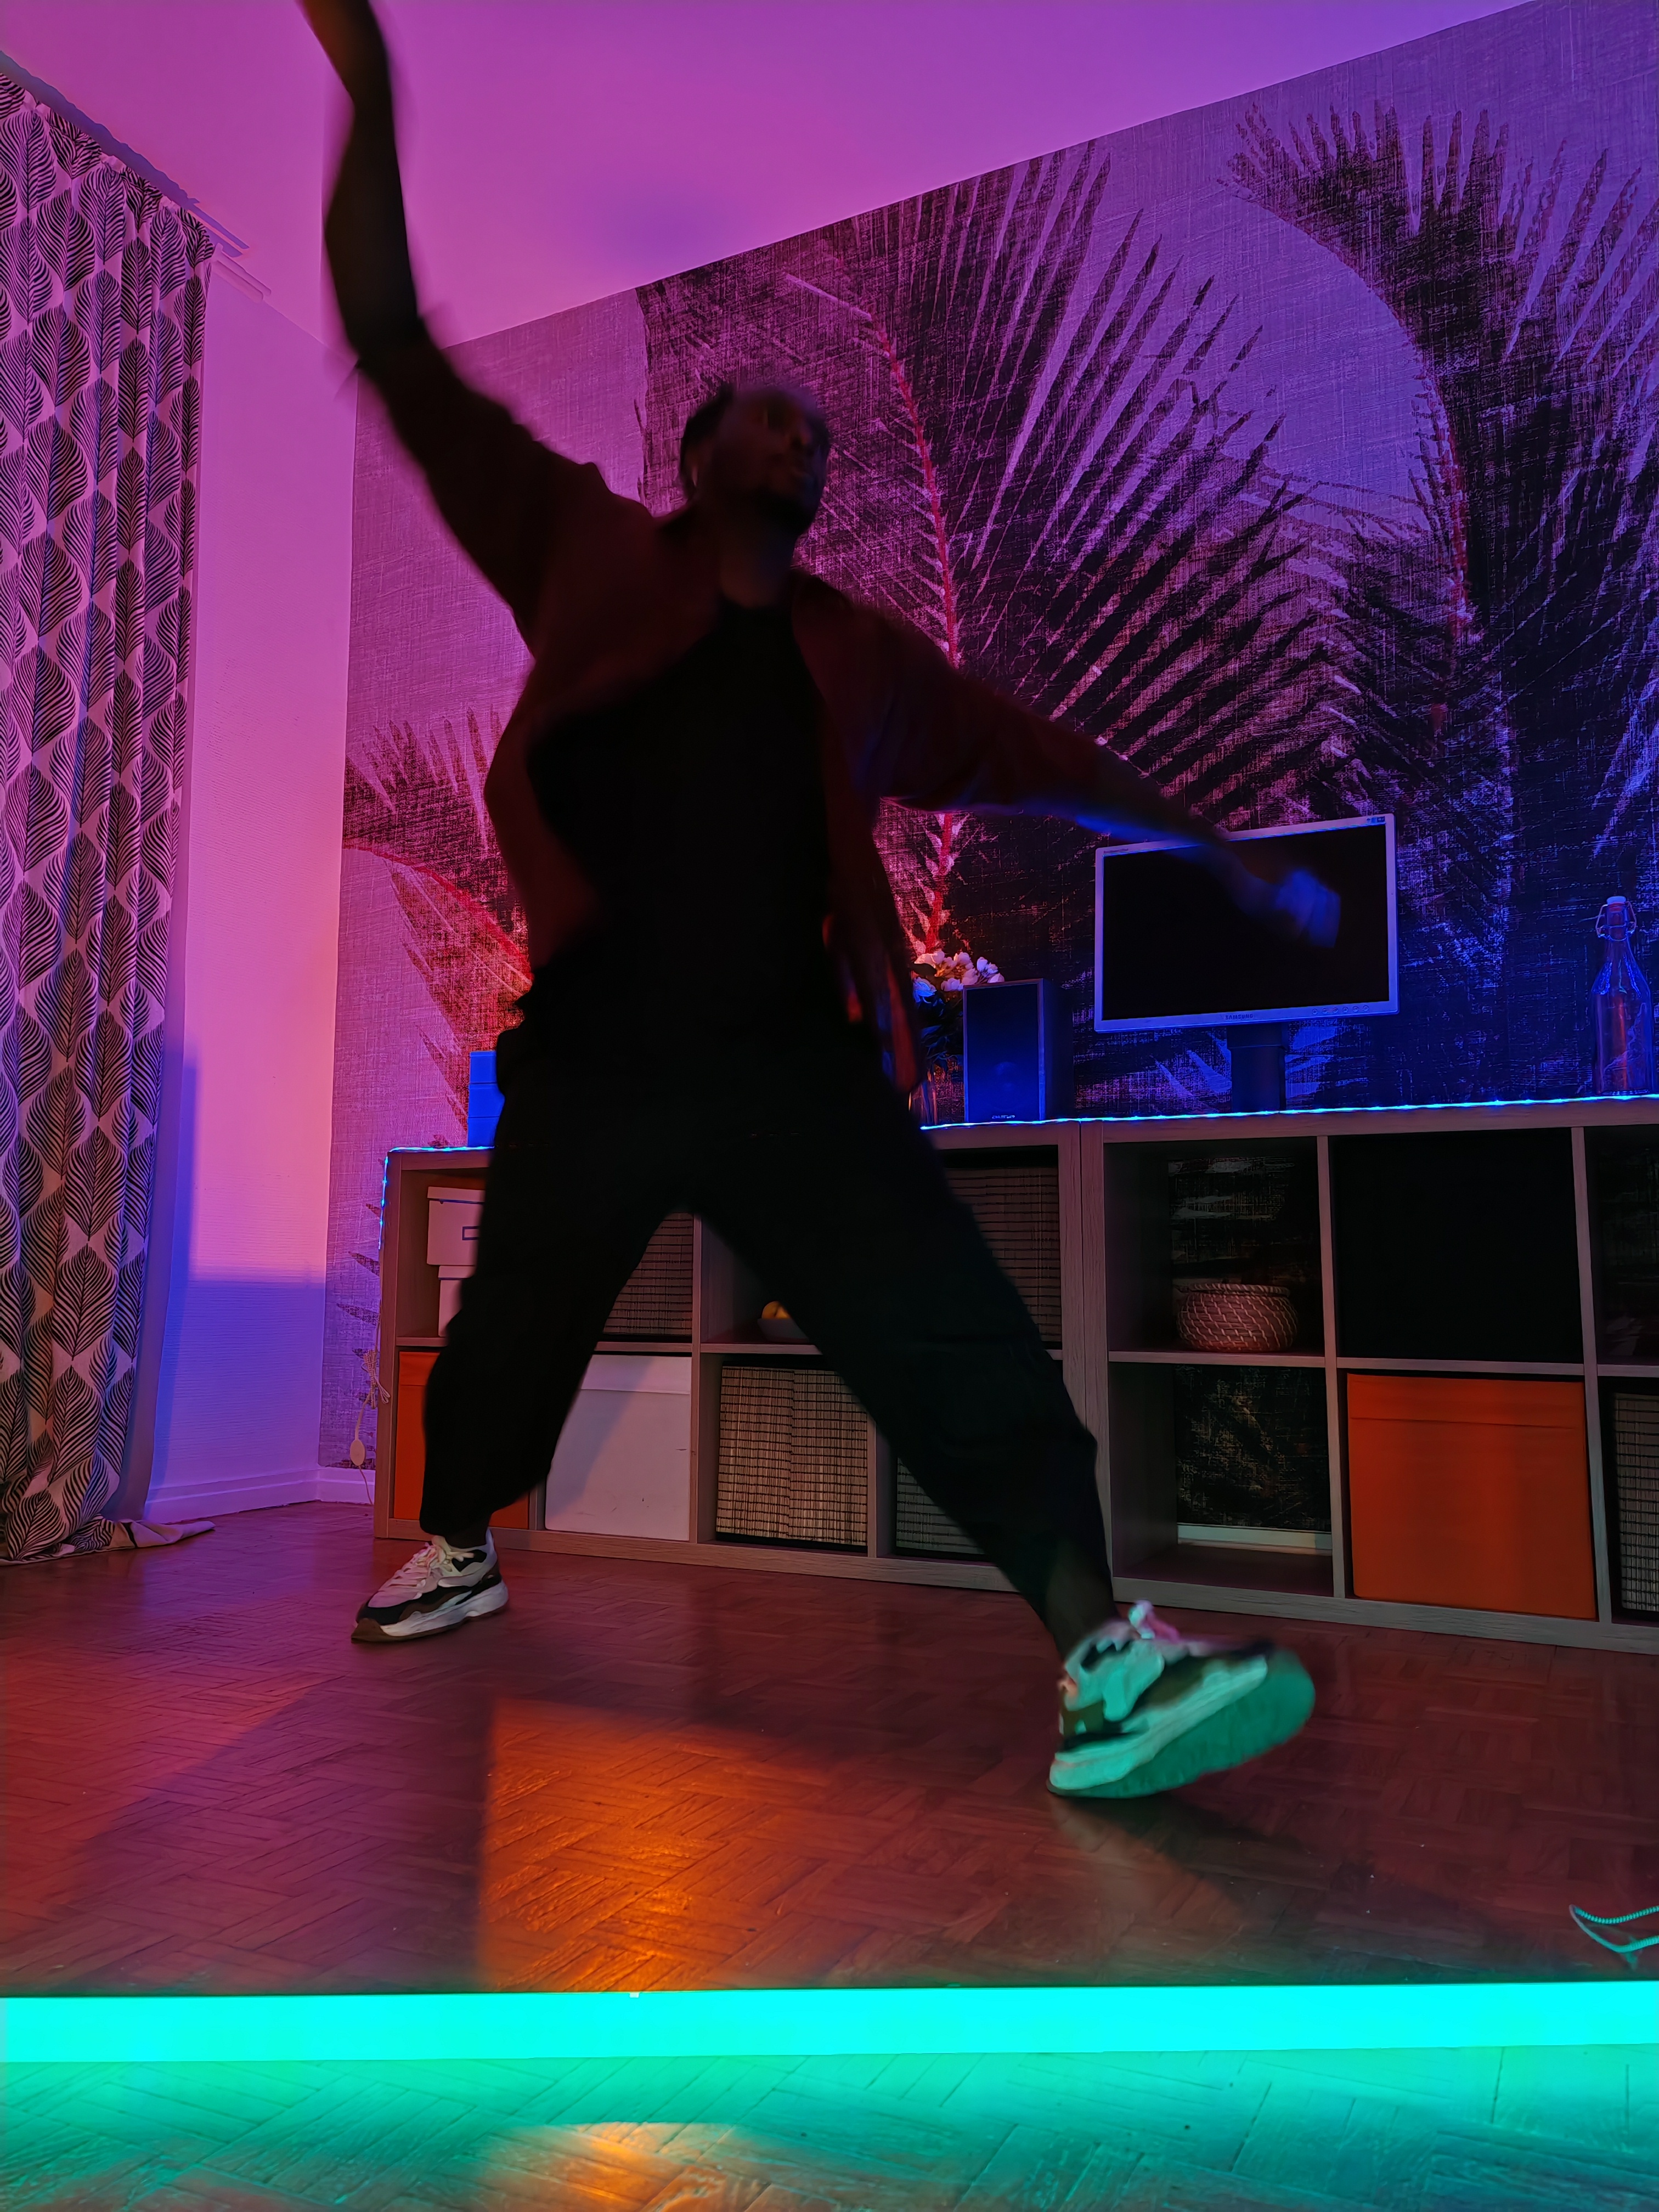
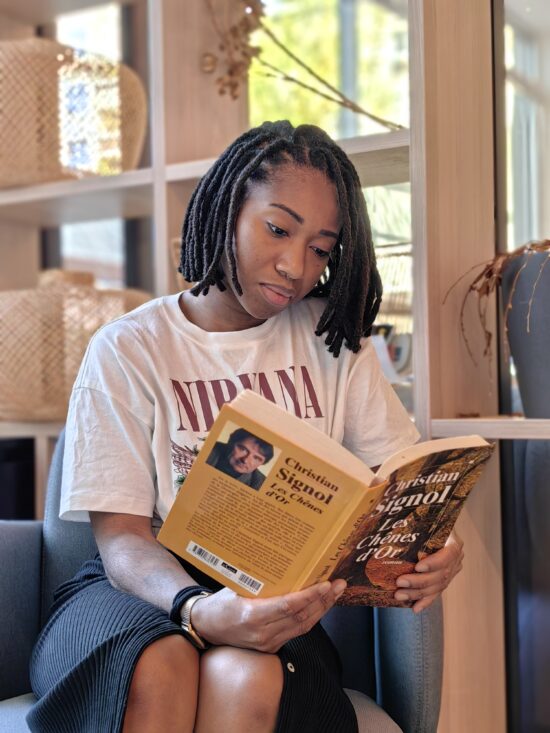
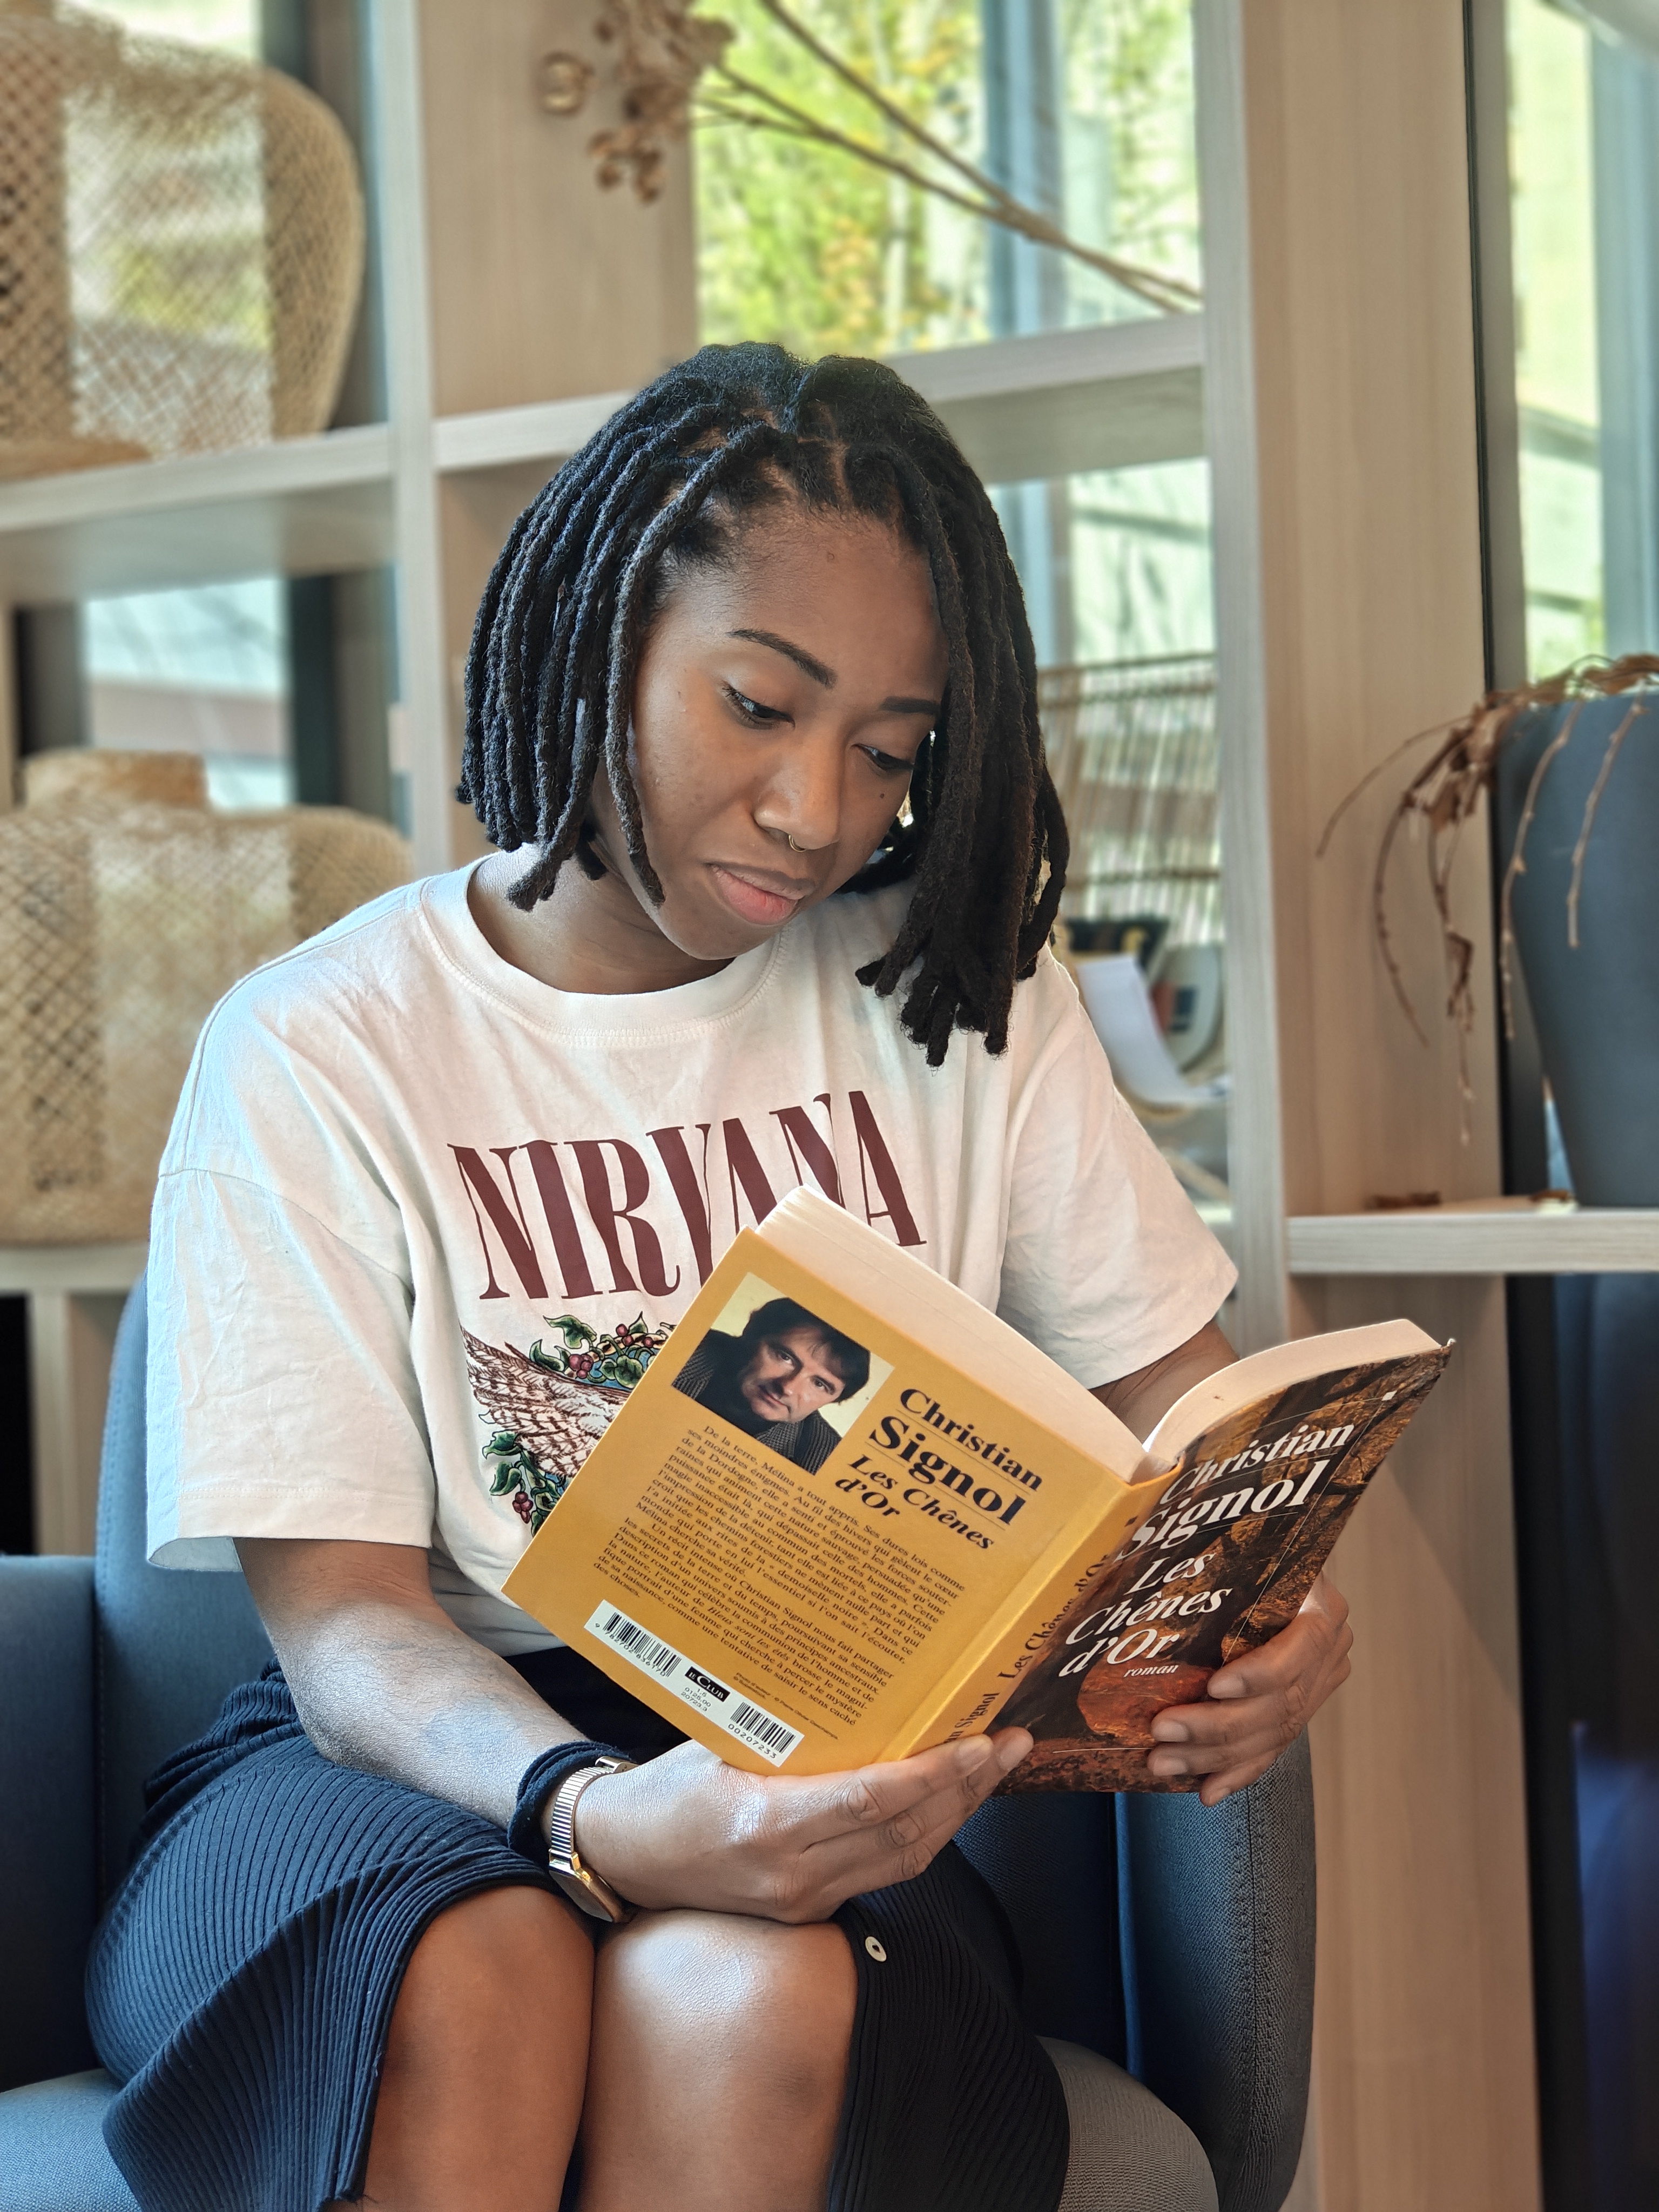
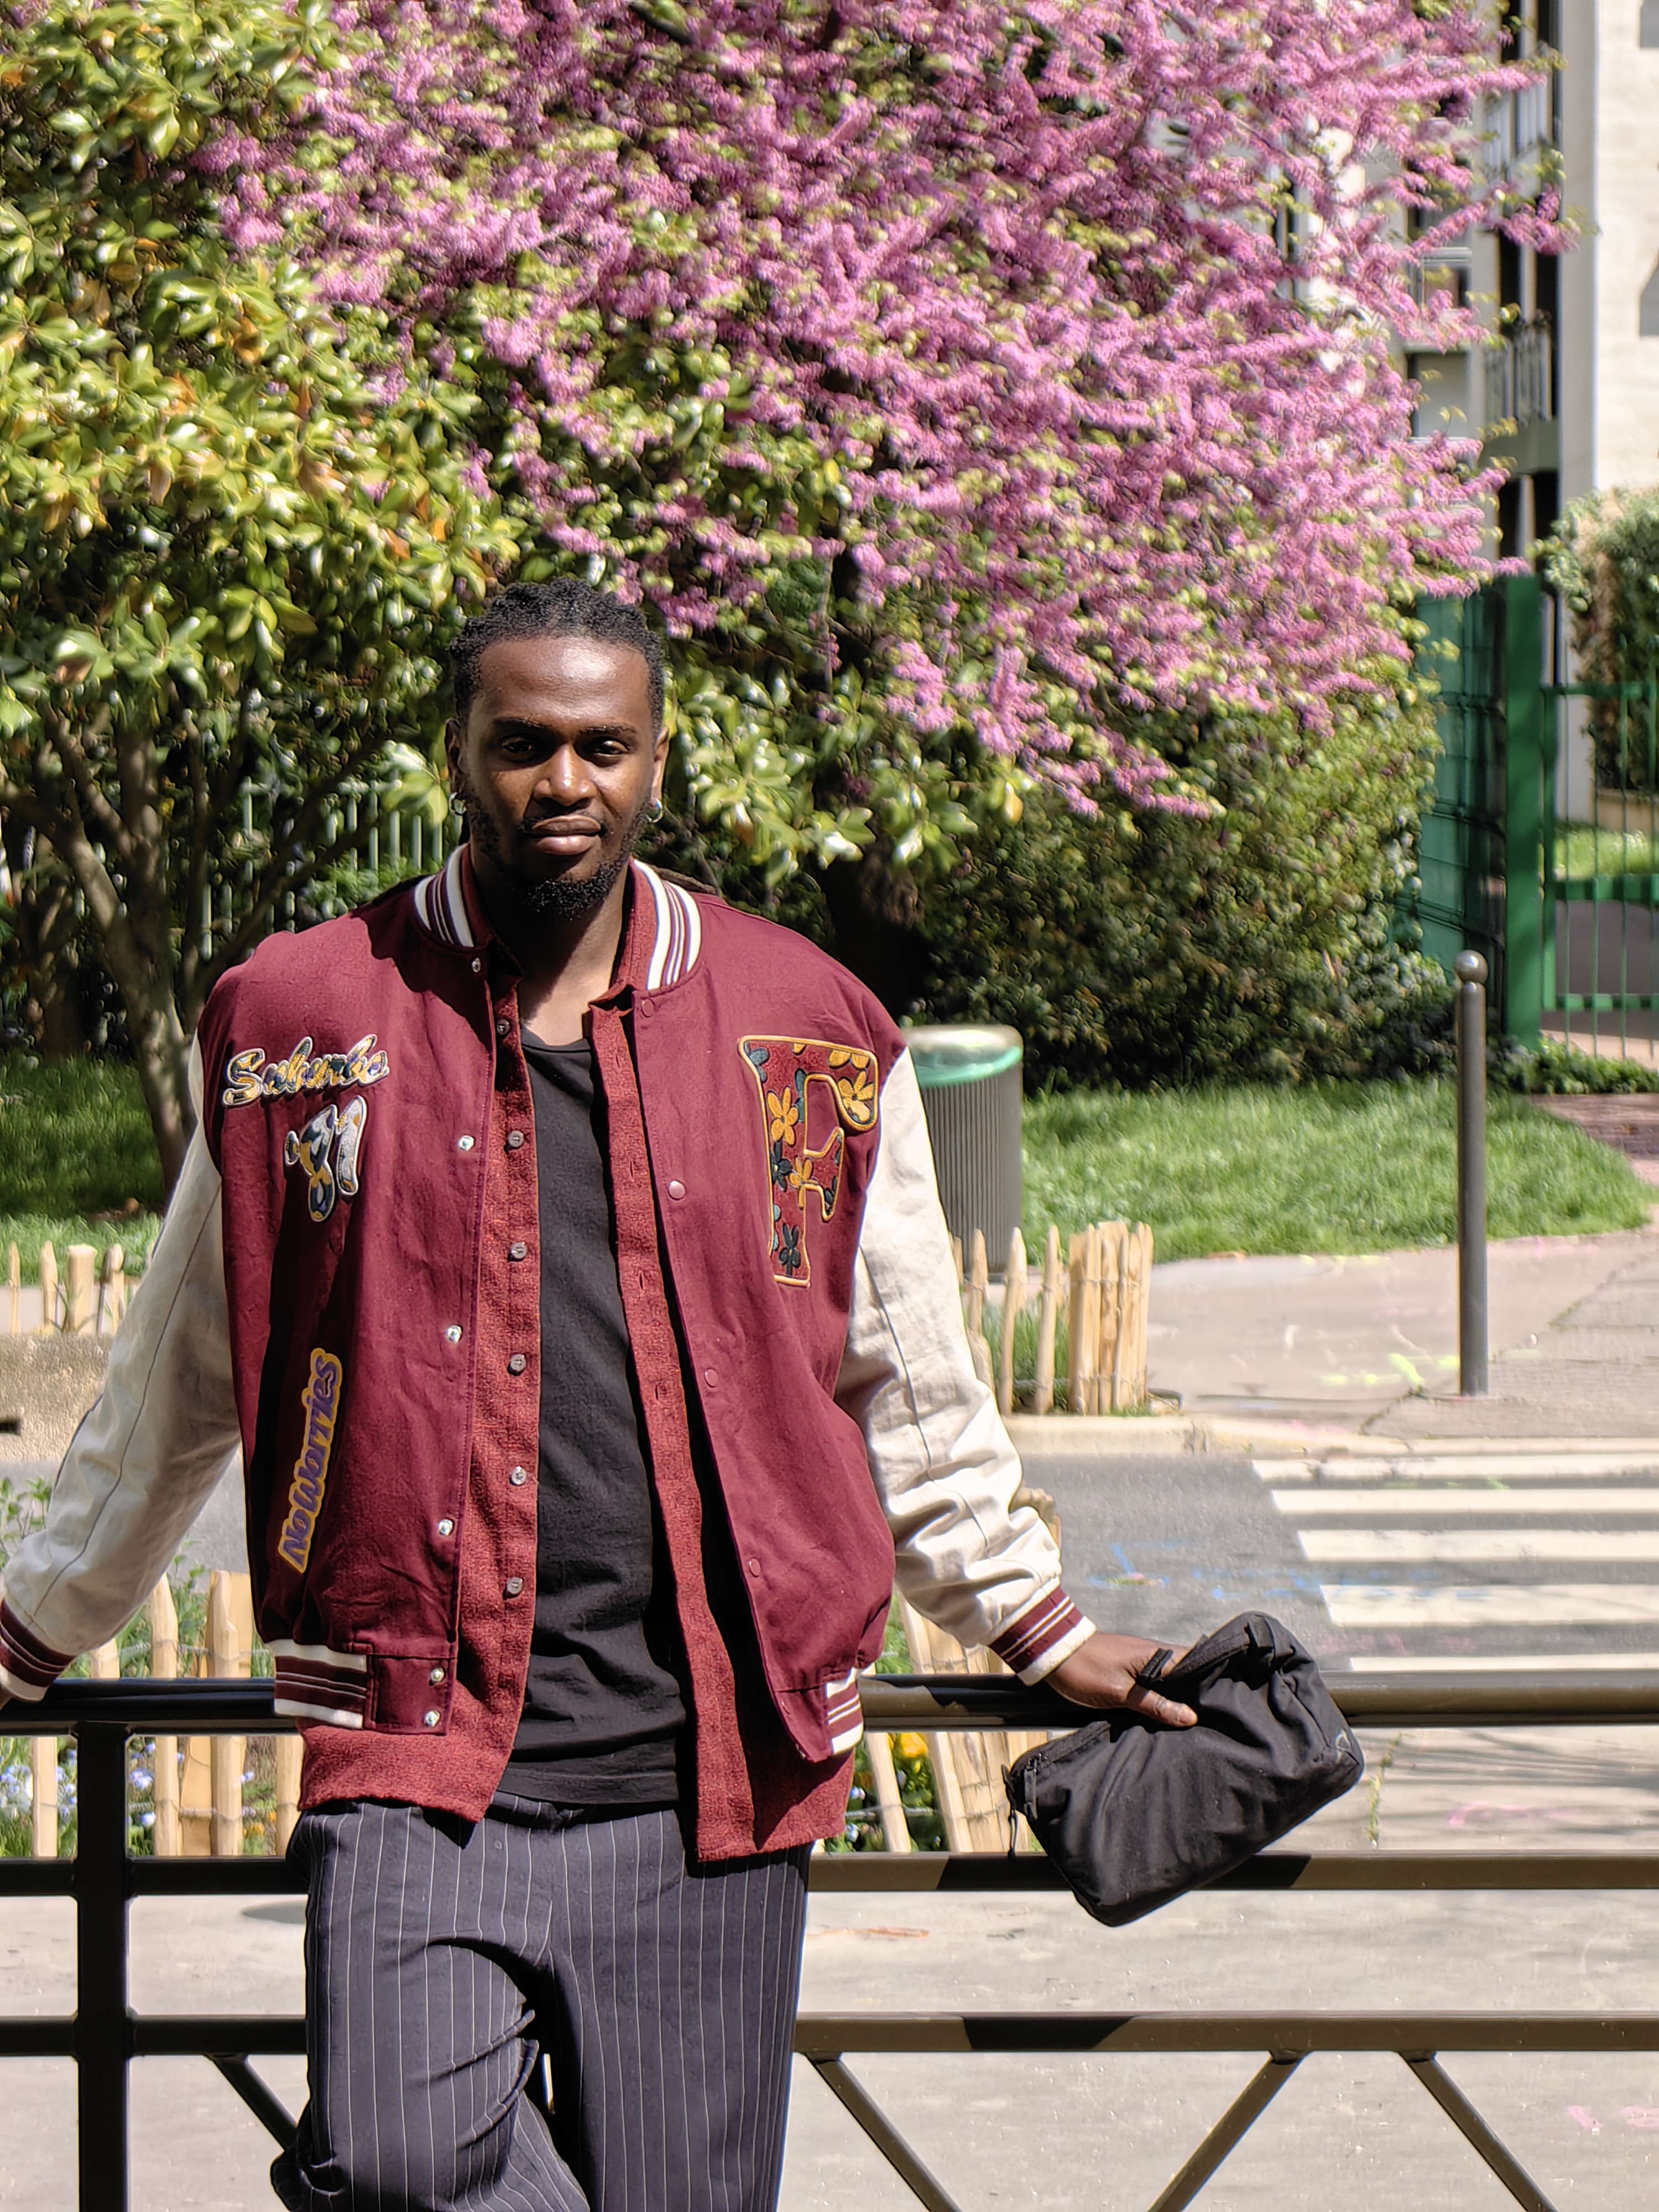
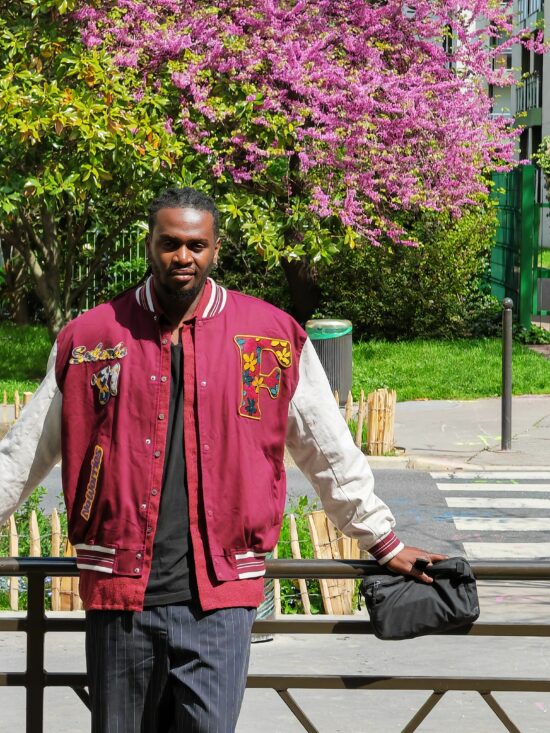
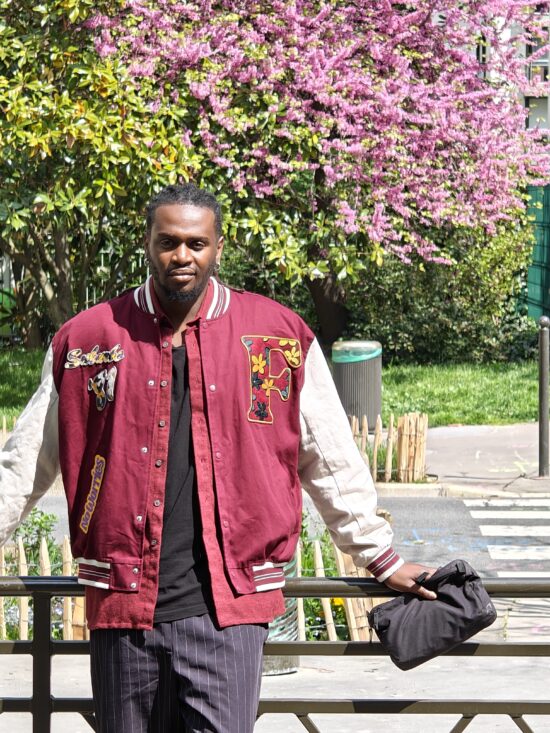
由于在具挑战性的人像场景中,P60 Pro的曝光平衡是目前为止我们所测试的机种中最为优异的,因此,其「朋友和家人」的用例表现非常出色。华为在棘手的逆光场景中能保有脸部的对比度,而且曝光准确还能保护高光位,如此的表现是无可比拟的。这款摄像头在大多数情况下所拍摄的照片和视频都能准确的呈现出不同的肤色。此外,即使在动态场景中,不论是在室内或是户外,它也很擅长定格动作并捕捉到清晰的主体,尤其是在低光下。就这方面来说,P60 Pro 的表现与 OPPO Find X6 Pro 和苹果 iPhone 14 Pro 等这些卓越的机种可说是不相上下。散景效果也很不错,非常接近DSLR 和大光圈镜头所呈现的图像。
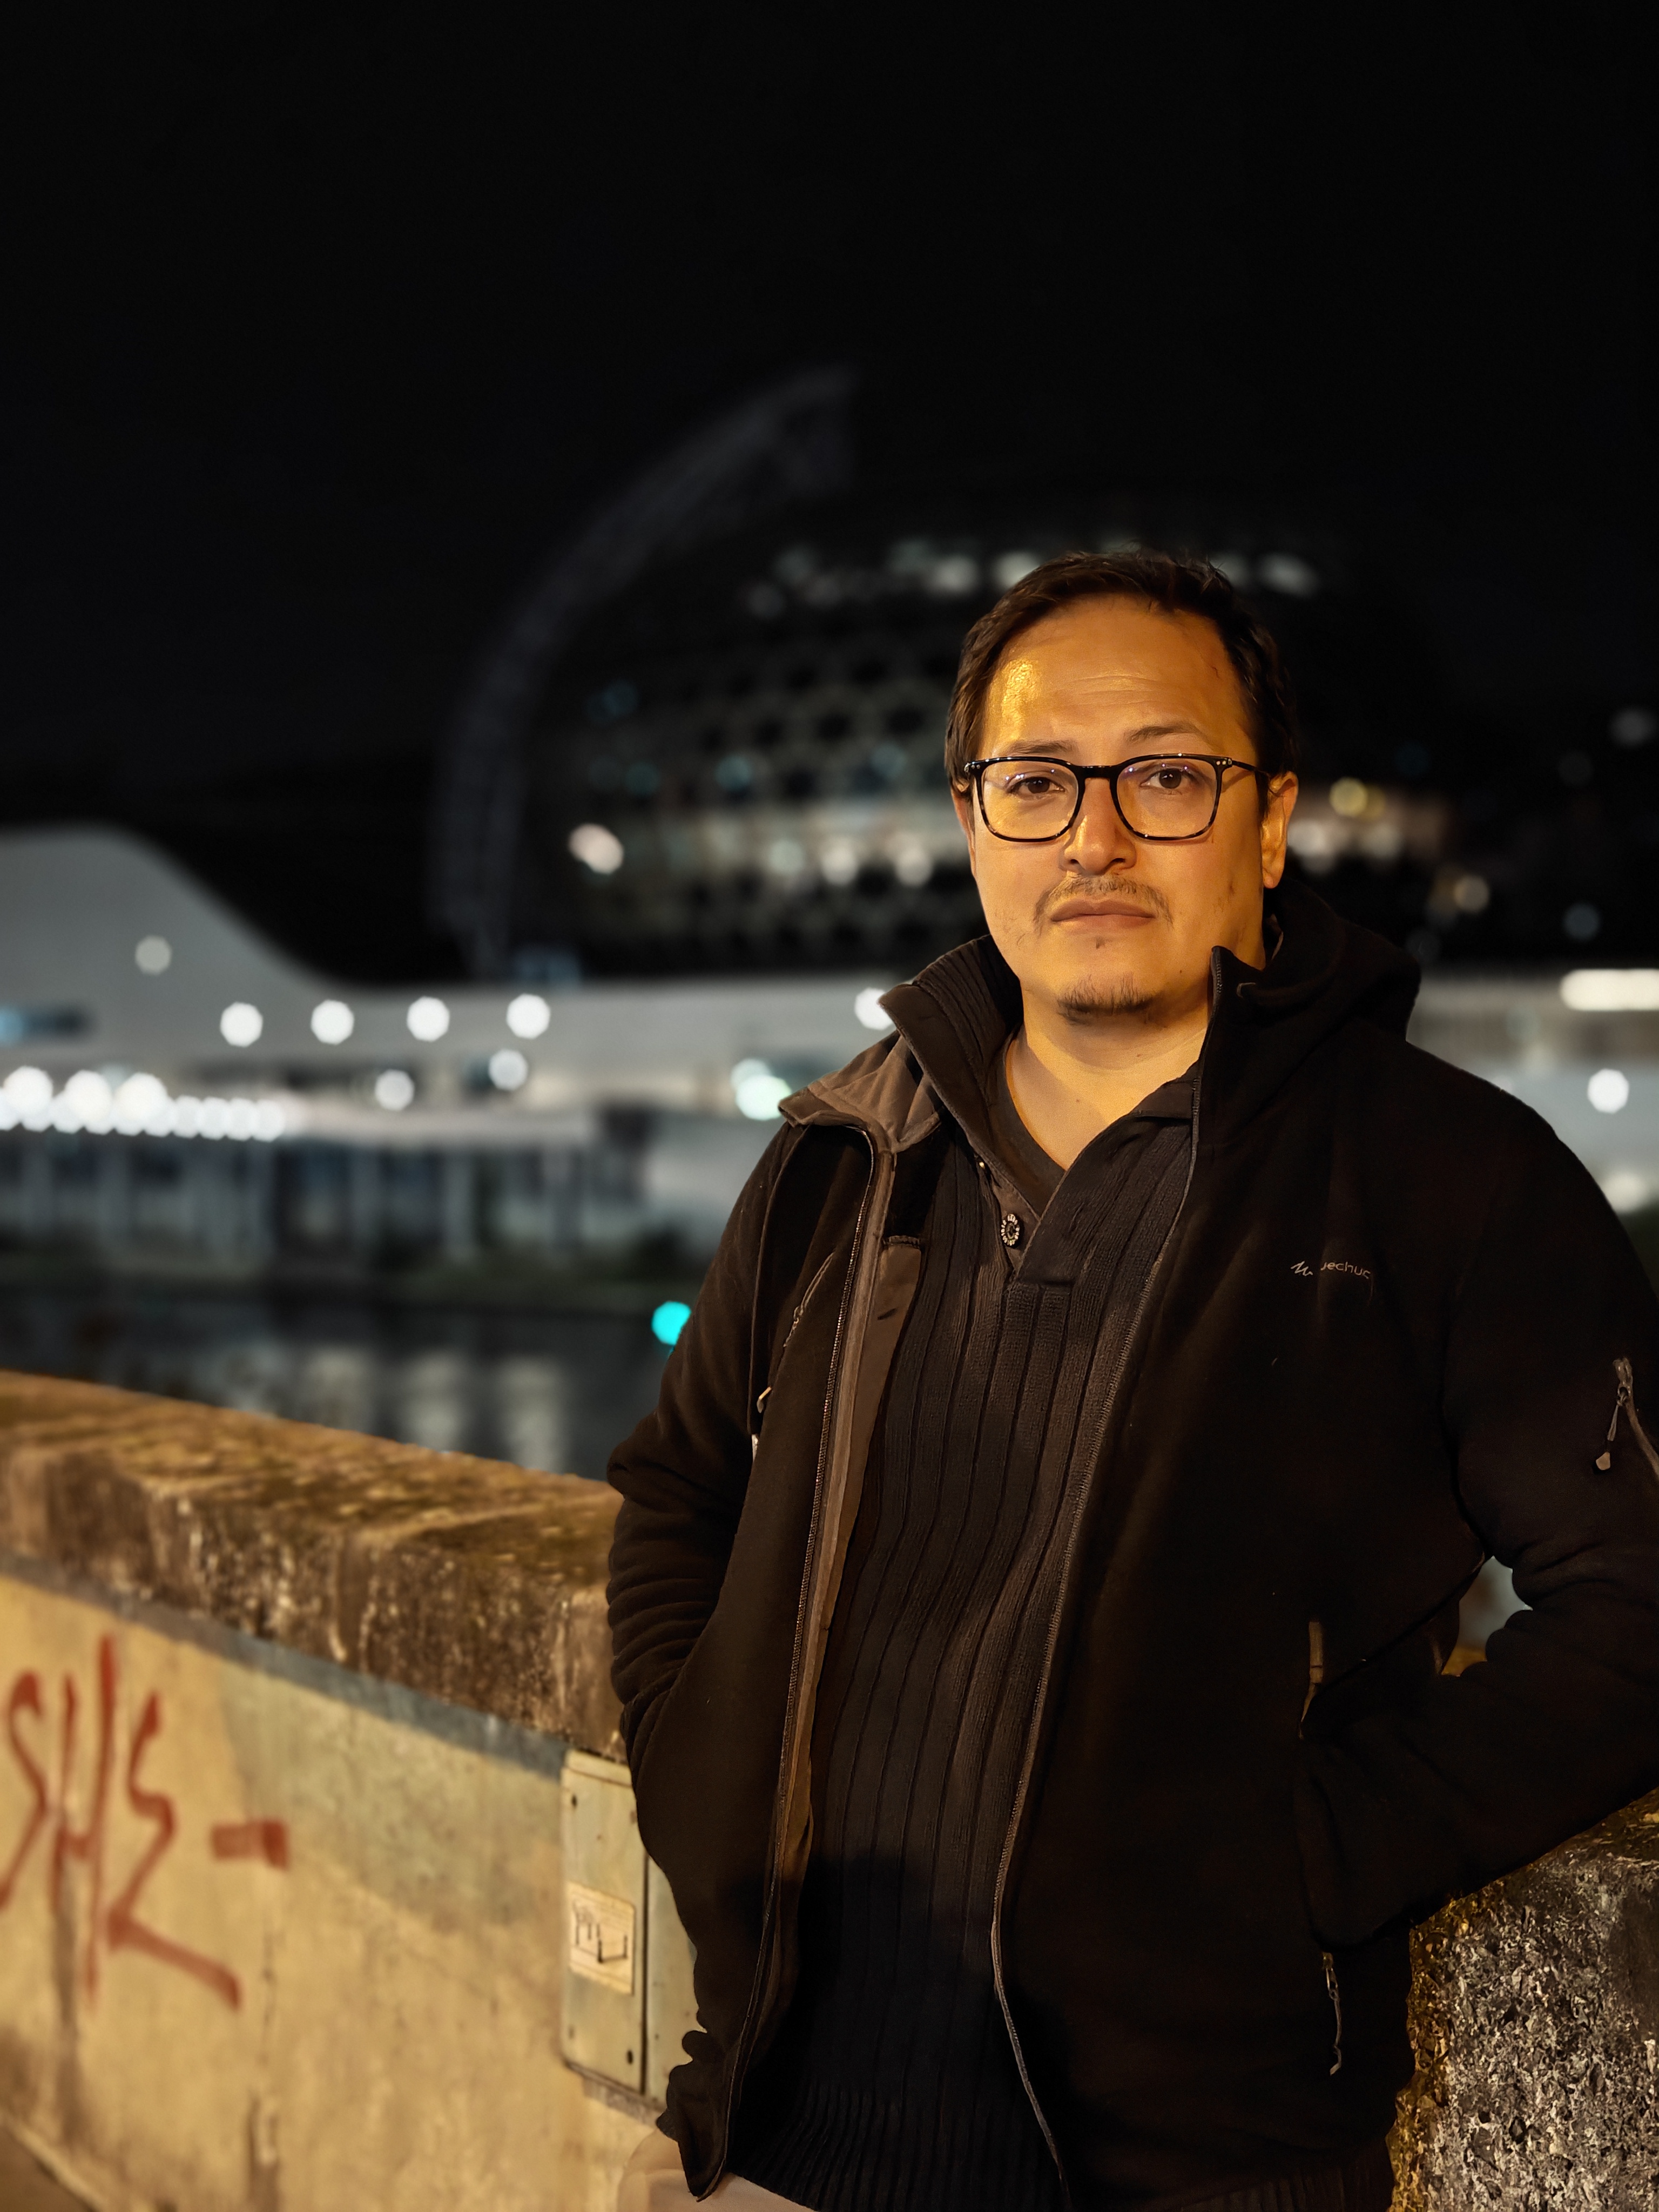
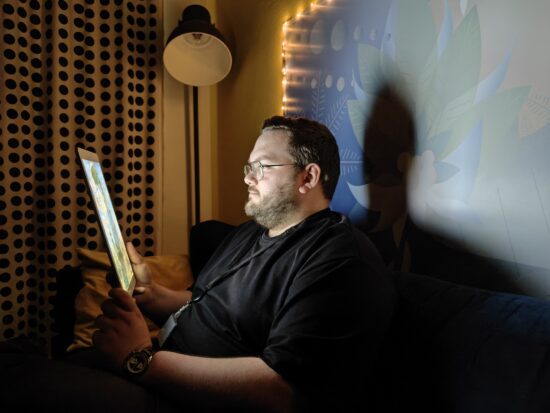
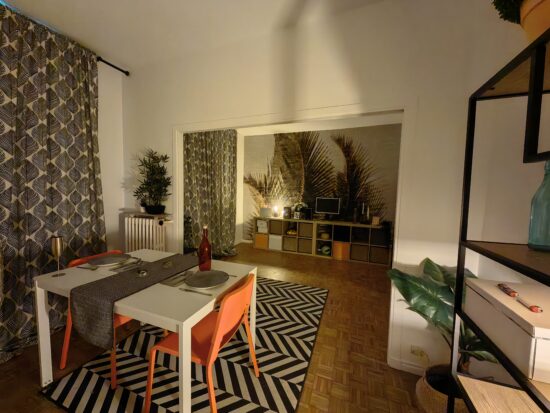
P60 Pro 是低光用例的新盟主。由于在昏暗的条件下,光圈能够调至 f/1.4,因此,即使在极低光下,曝光也很好。色彩自然,就算是在夜间拍摄时也是如此,而且此摄像头能够捕捉到相当丰富的细节,同时还能将噪点控制得不错,尤其是在照片模式下。P60 Pro 在低光下的主要优势之一是能够定格动作并保持最低限度的运动模糊。
在低光下使用远摄变焦时,这款摄像依旧能拍摄到很不错的细节,这可归功于当光照水平低至 5 勒克斯时能有效的运用图像融合算法。即使在长远摄(约 200 毫米等效焦距)的情况下,P60 Pro 所呈现的细节也比其在远摄变焦类别中的主要竞争对手来得好。
低光视频影片也颇具竞争力,曝光良好且整体白平衡相当准确。低光下的防抖功能与自动对焦依然有效。
测试摘要
关于DXOMARK摄像头测试:在 DXOMARK 进行 Camera 评鉴时,我们在实验室和现实生活情境中拍摄各种各样的主题,然后根据客观测试和感知测试来进行评分。进行客观测试时,我们使用实验室环境中的测量软件直接计算测试结果;感知测试则是由一群图像专家根据一套复杂的度量标准,就需要人为判断的图像质量进行各个方面的比较。智能手机测试需要一个由工程师和技术员组成的团队进行大约一周的测试。他们分别对照片、变焦和视频质量进行评分,然后将这些分数合并为总分,以便在不同手机的摄像头之间进行比较。关于DXOMARK摄像头基准的更多信息,请点击这里。关于智能手机摄像头得分的更多细节,请点击这里。以下部分集合了我们在DXOMARK实验室进行的详尽测试和分析的主要内容。根据需求,我们可以提供更详细的性能评估报告。您可以与我们联系。
照片
Huawei P60 Pro
169
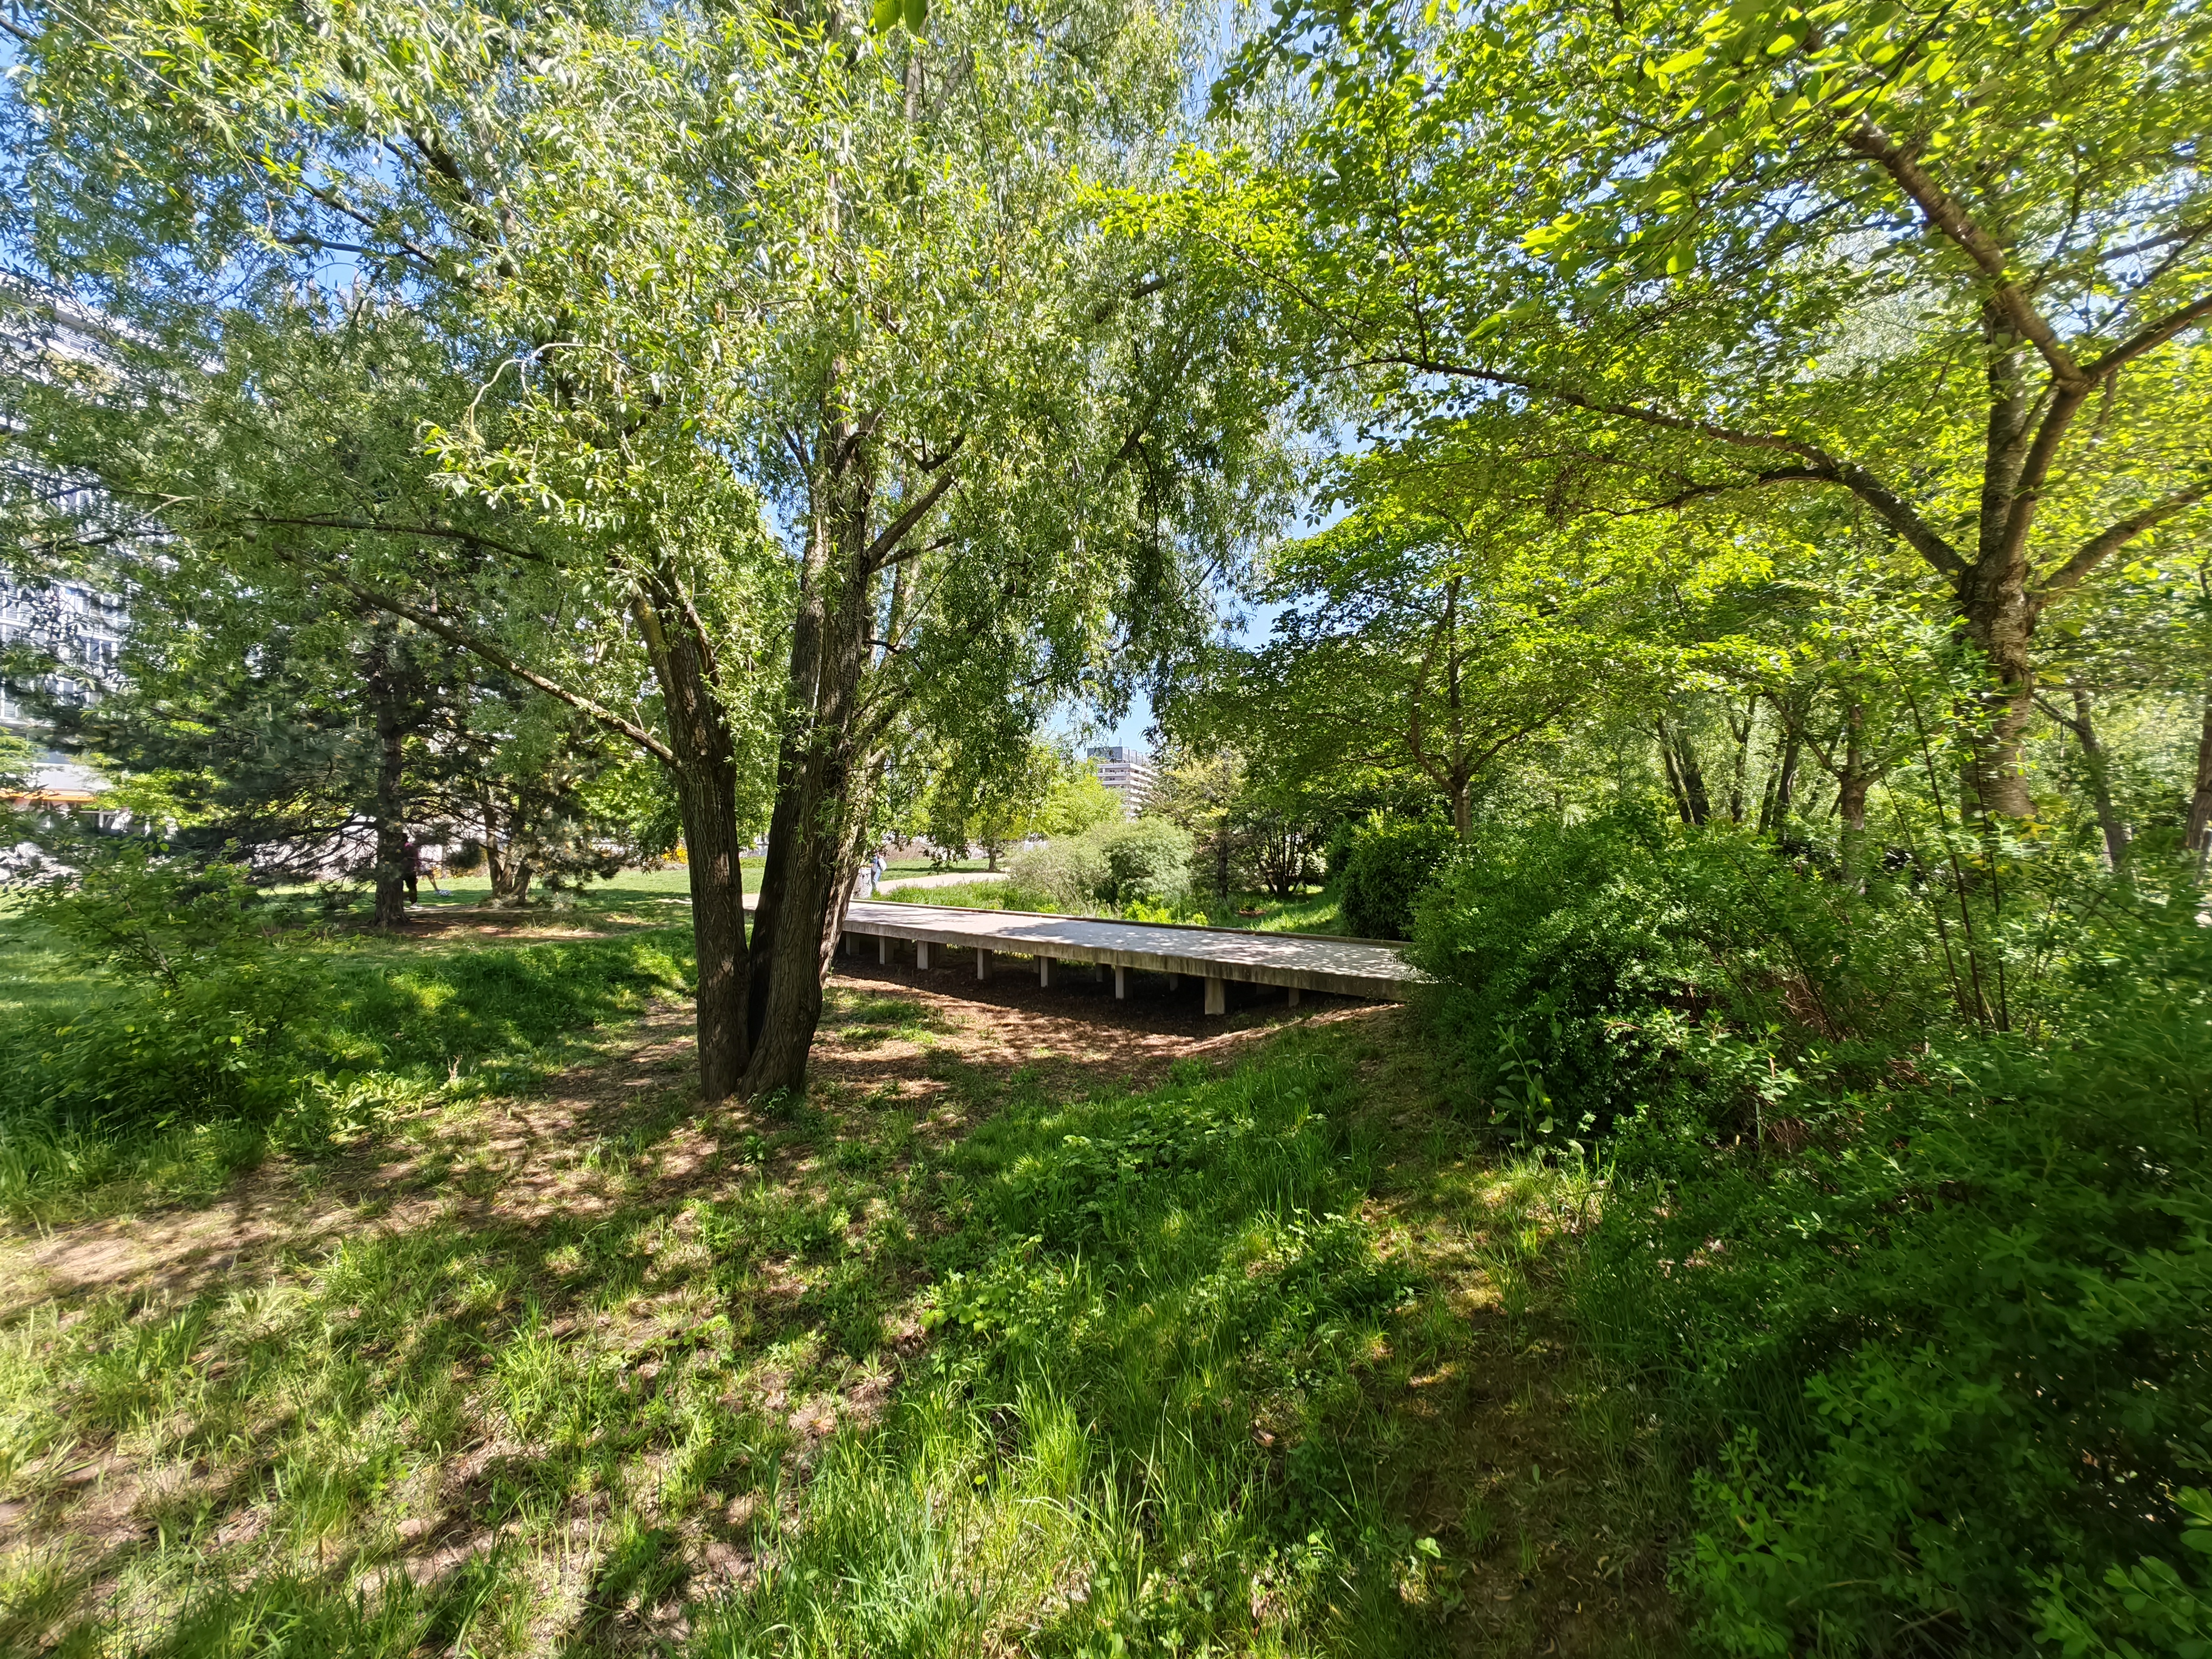
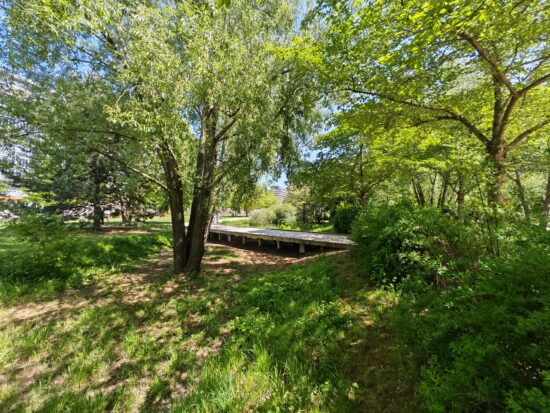
DXOMARK 工程师在摄像头的默认设置下,在受控的实验室环境和户外、室内,以及低光的自然场景中拍摄超过 2600 张测试图像,之后评鉴拍摄结果,以实现摄像头拍照性能的评分和分析。照片评测基准考虑了一些主要用例,其设计则基于典型的拍摄场景,例如人像、家庭和风景摄影。评鉴照片时,我们根据自然场景的参考标准,对图像进行目视检查,并在实验室 1 到 1,000+ 勒克斯和色温 2,300K 到 6,500K 的不同照明条件下对着图片进行拍摄,以对图像进行客观测量。
华为 P60 Pro 是目前为止我们照片项目评比中表现最岀众的机种,也使其成为拍摄各种静态图像时的最佳选择。除了在其他所有测试项目中的表现始终如一的优秀外,它的自动对焦和曝光度也非常出色。
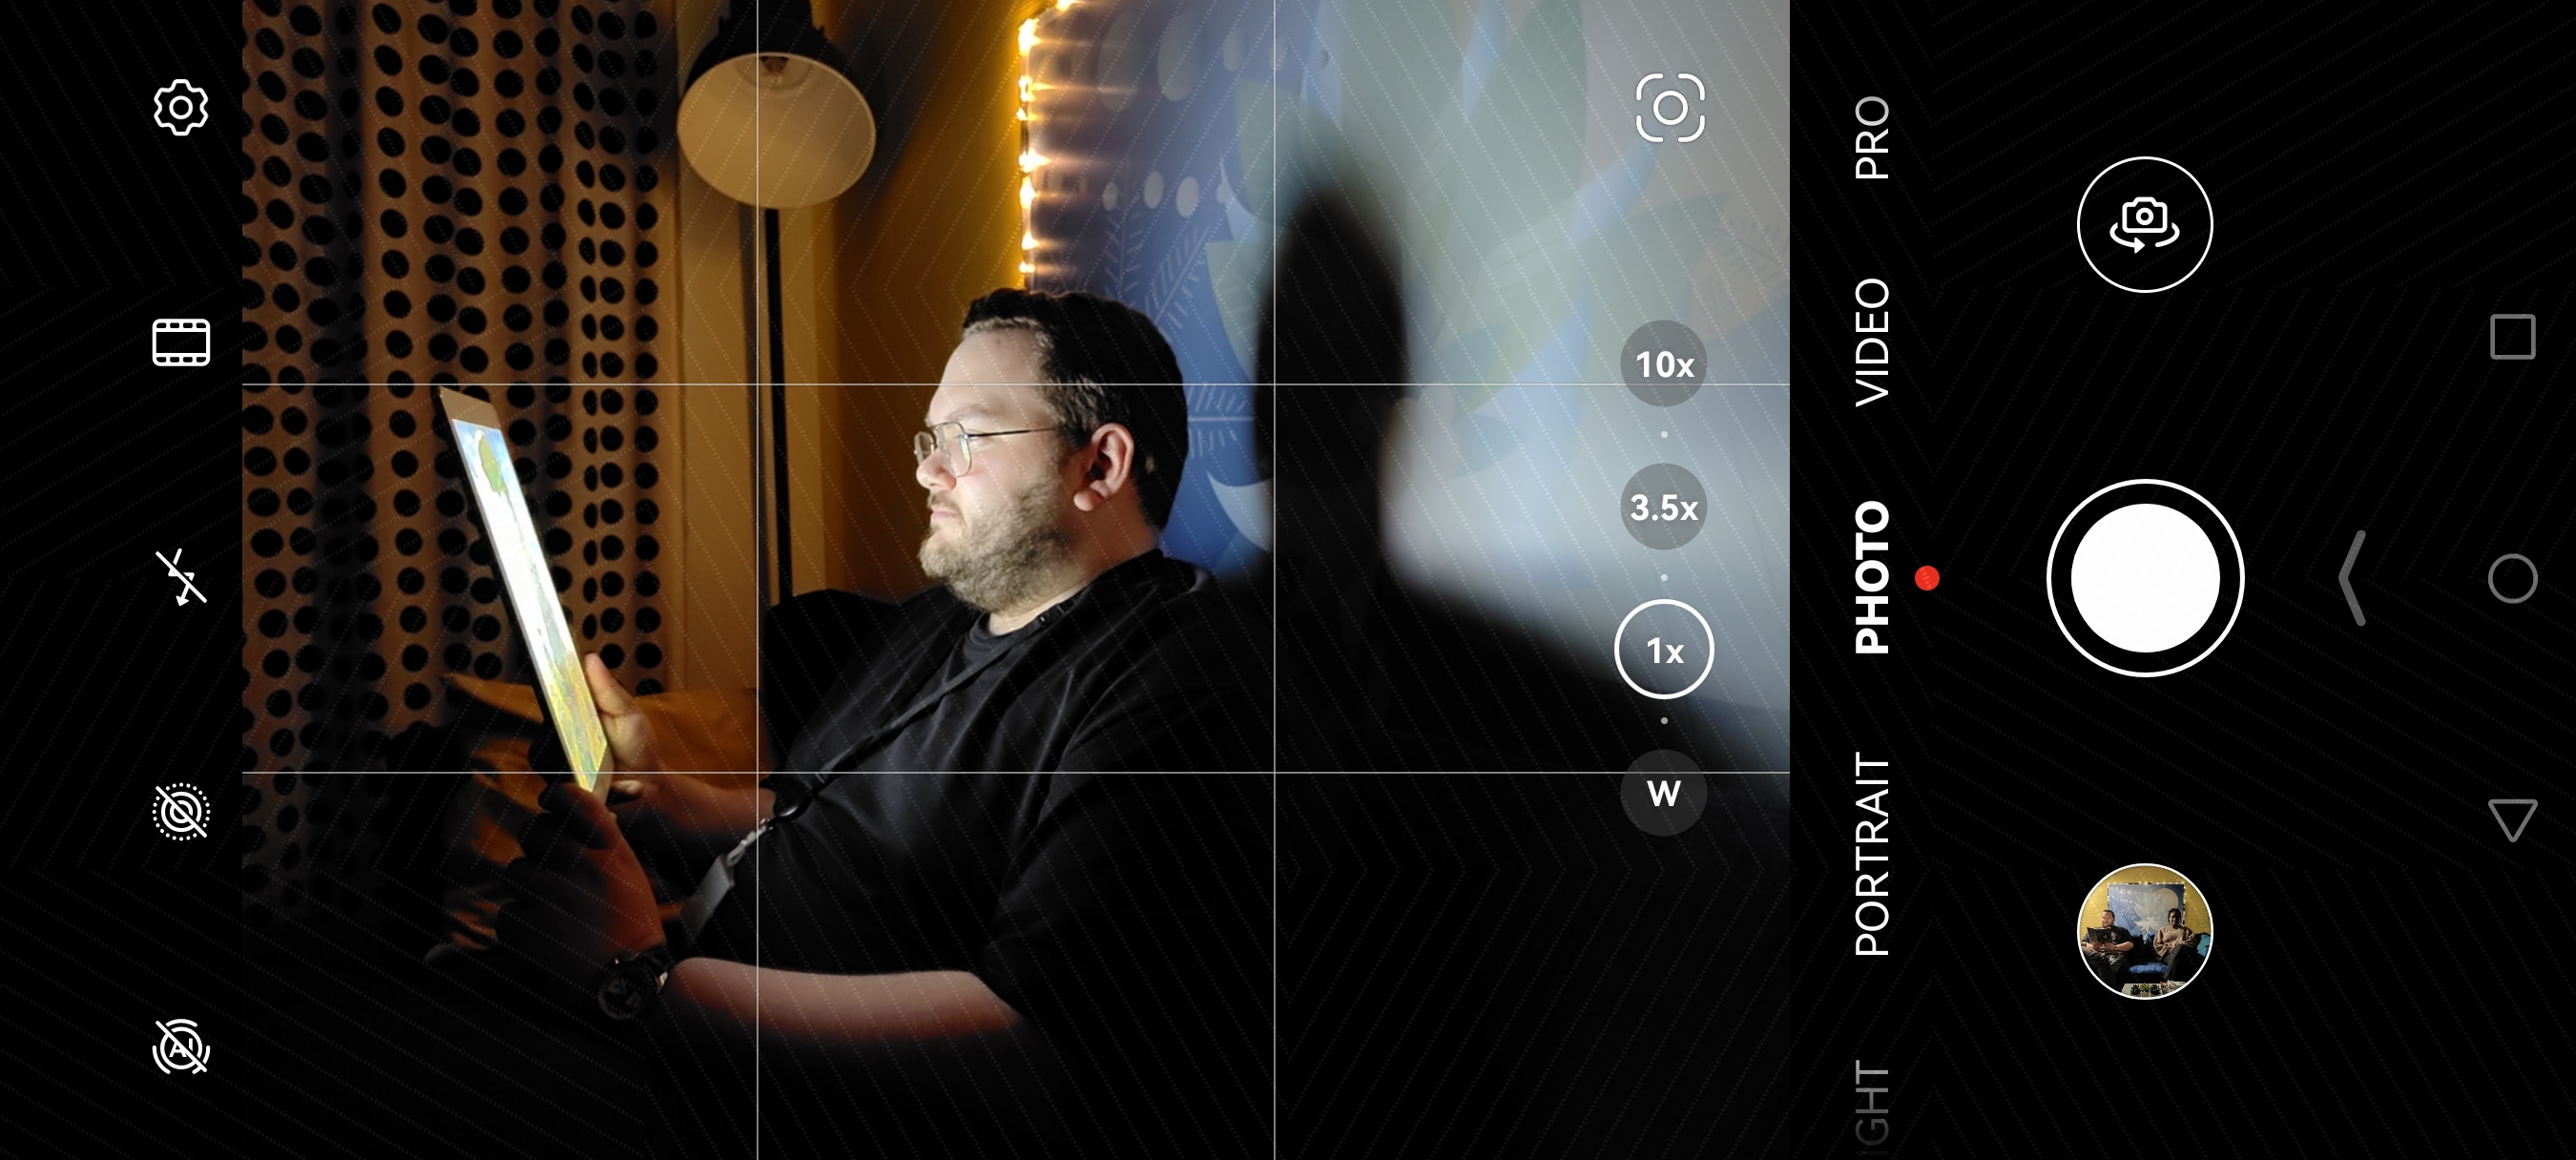
在我们的测试中,这款摄像头能够使用零延迟快门,因此,在所有光照条件下,按下快门时都能立即捕捉到图像。这可归功于其可变光圈(这对智能手机的摄像头来说仍是相当罕见的功能),以及会依据场景而缜密考虑的自动光圈控制,它还能展现出比当前所有旗舰机种都还来得宽广的景深。
由于场景的曝光良好、动态范围宽广以及对比度佳,即使在最具挑战性的光照条件下(如对比度高和逆光场景),曝光性能也非常出色。在如此严苛的情况下,明显可看出与竞争对手的差异;对比机种必须在曝光、动态范围或对比度方面做出妥协。
与上一代 P 系列机种相比,我们的专家发现白平衡和肤色准确度都还有进步的空间,整体来说,华为 P60 Pro 在大多数情况下都能呈现出漂亮的色彩和不错的饱和度。此外,纹理/噪点间的取舍处理得宜,所有光照条件下的细节水平也相当高。不必要的伪像控制得不错,只有偶尔会出现一些耀斑和融合伪像。
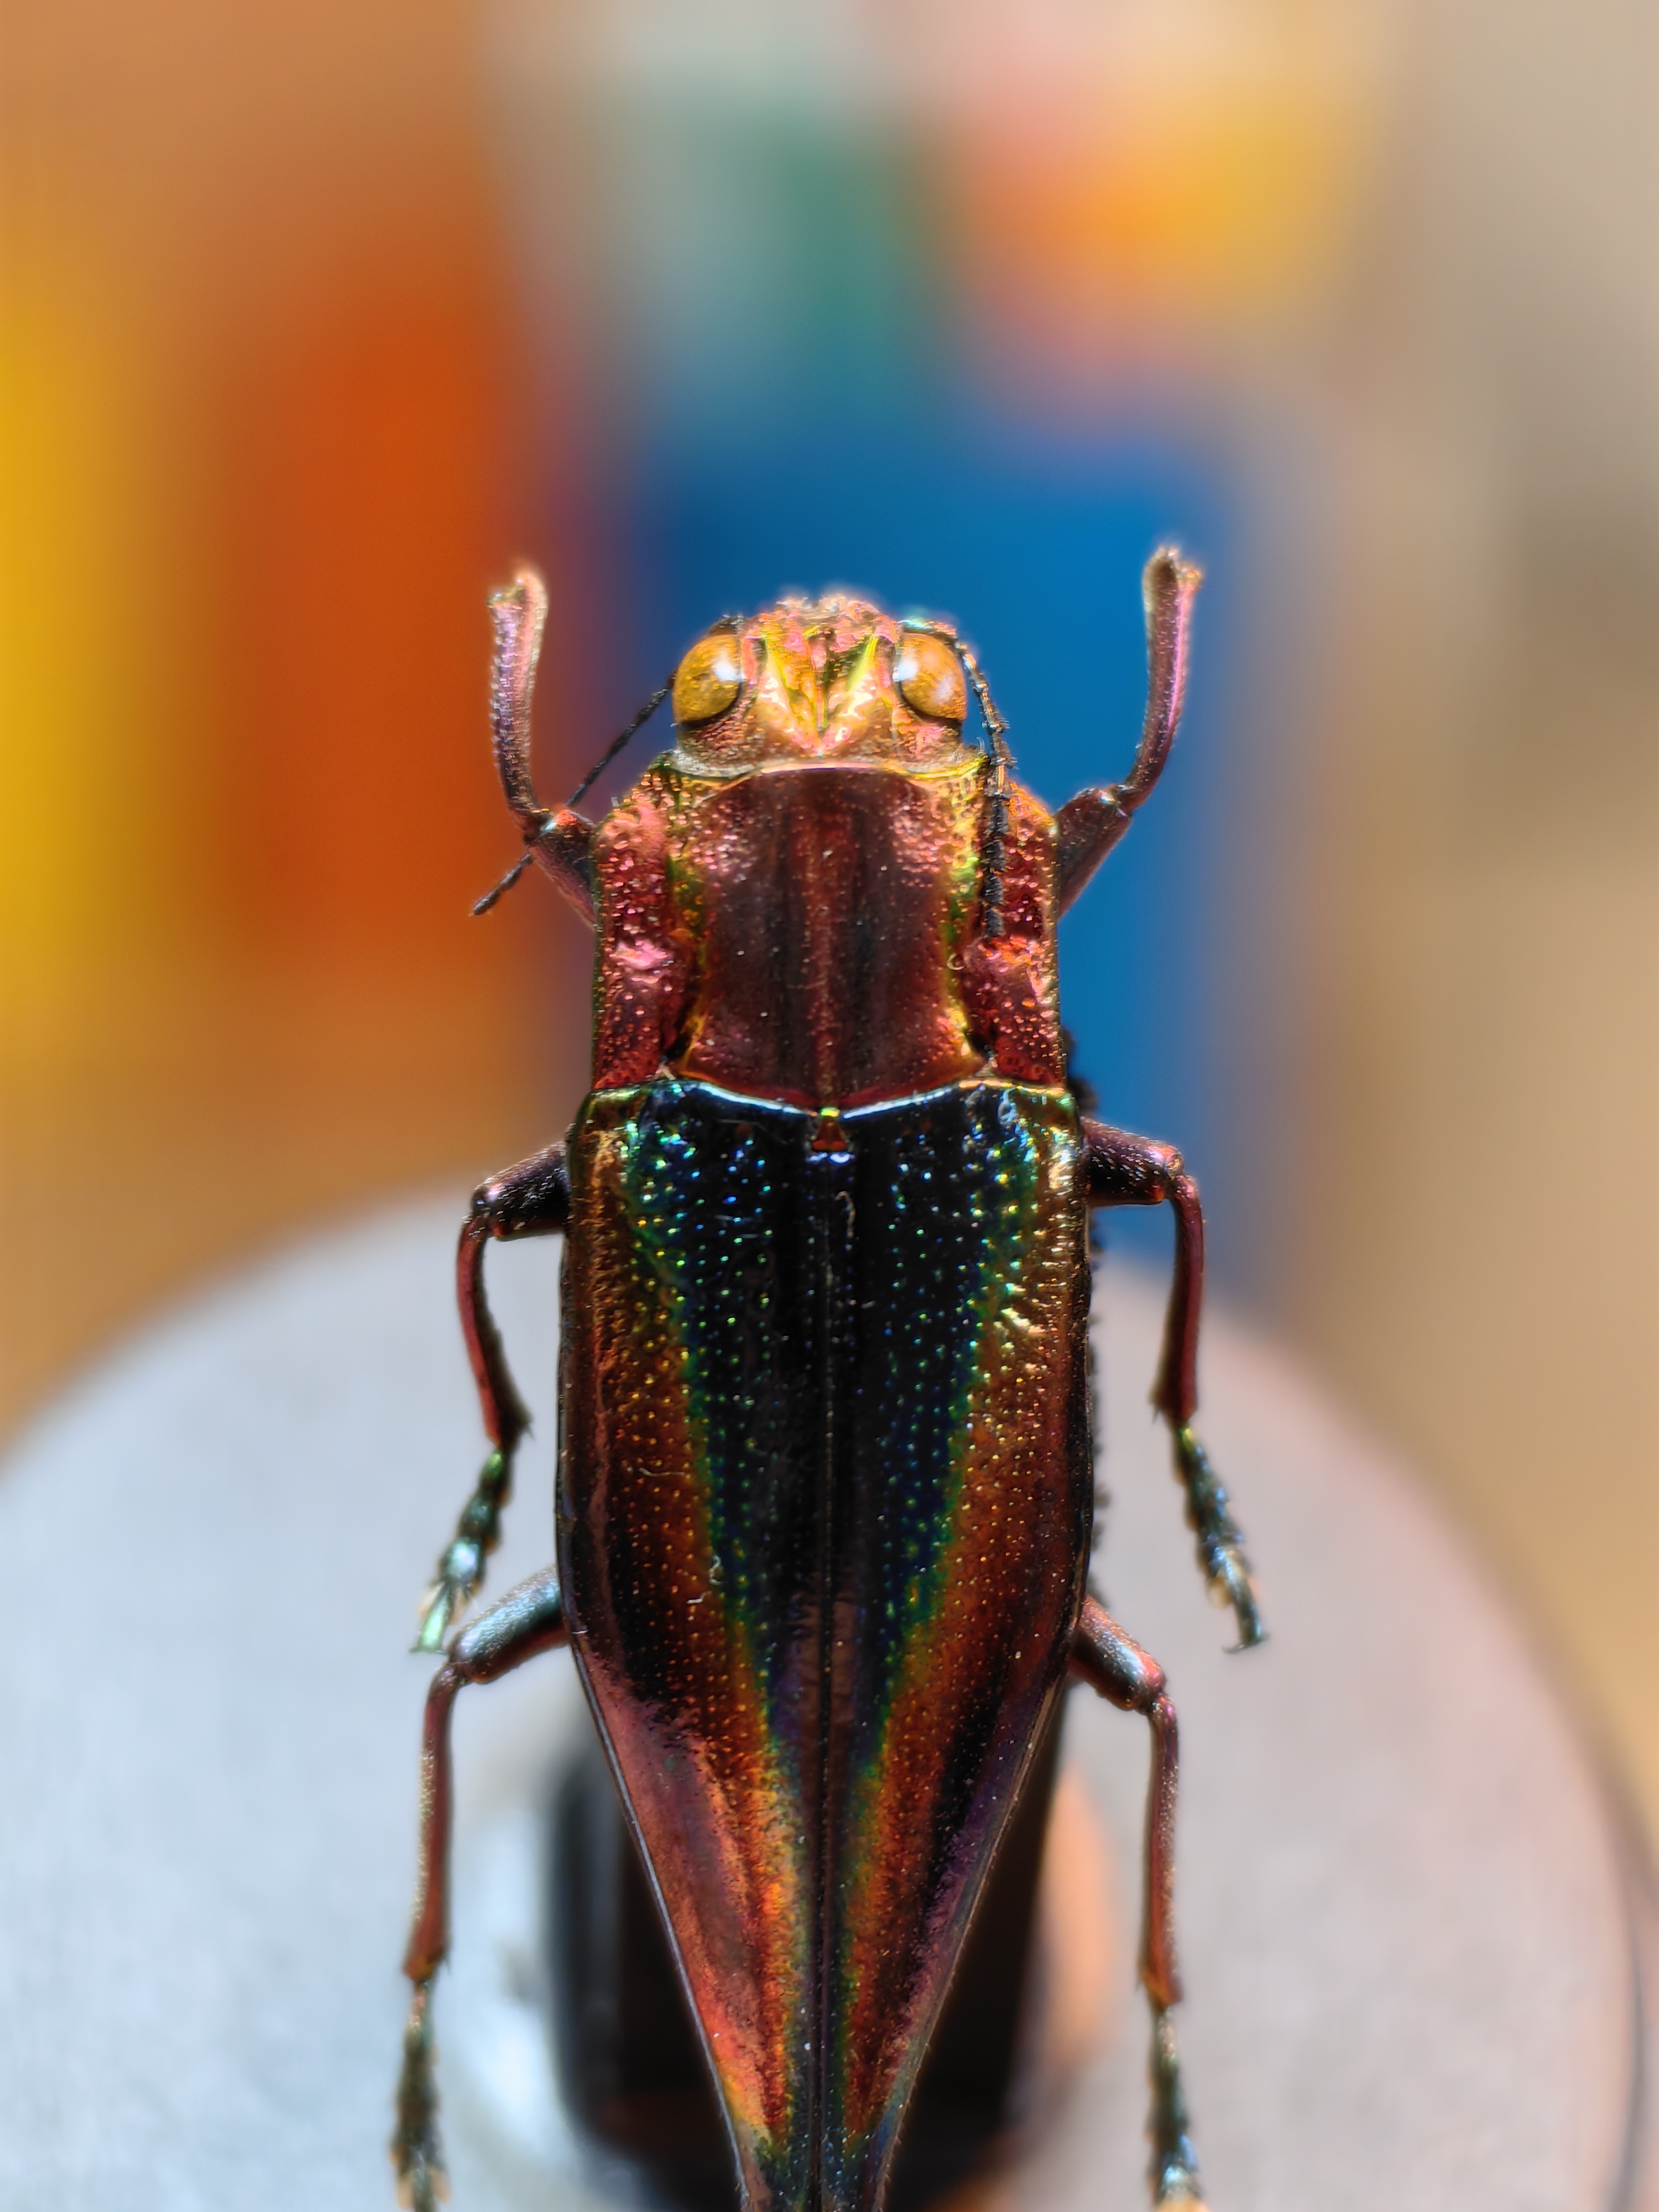
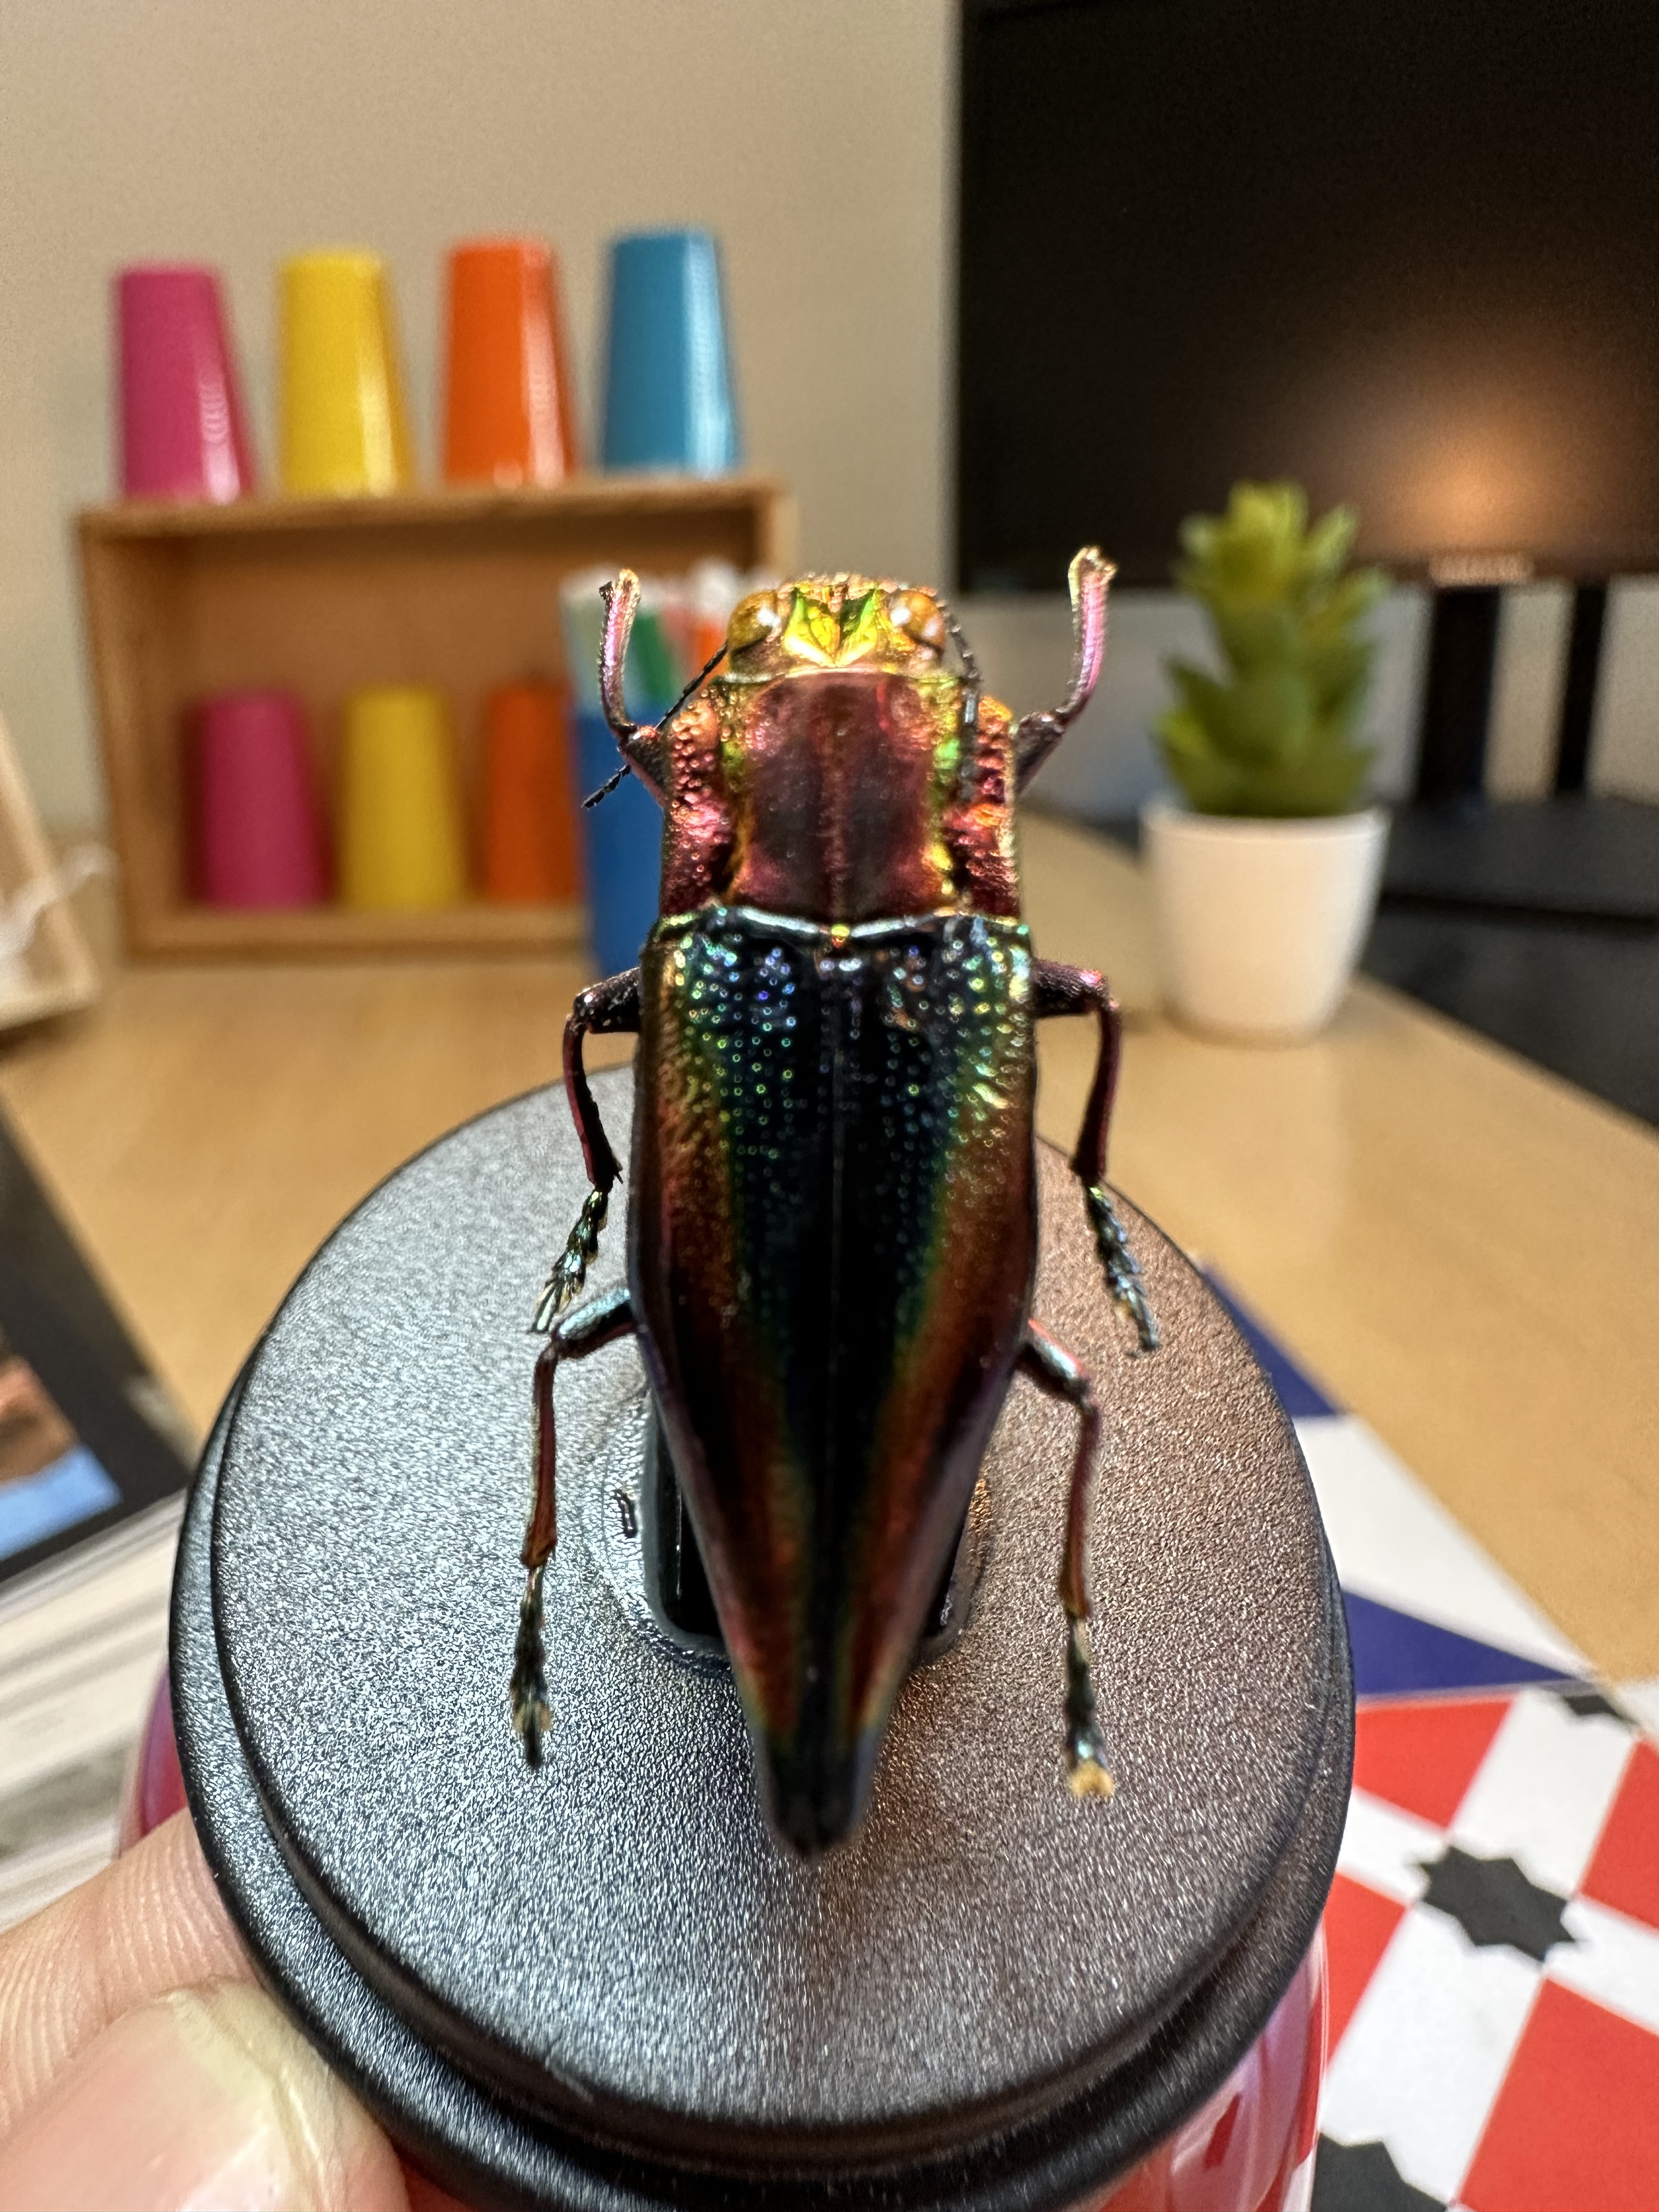
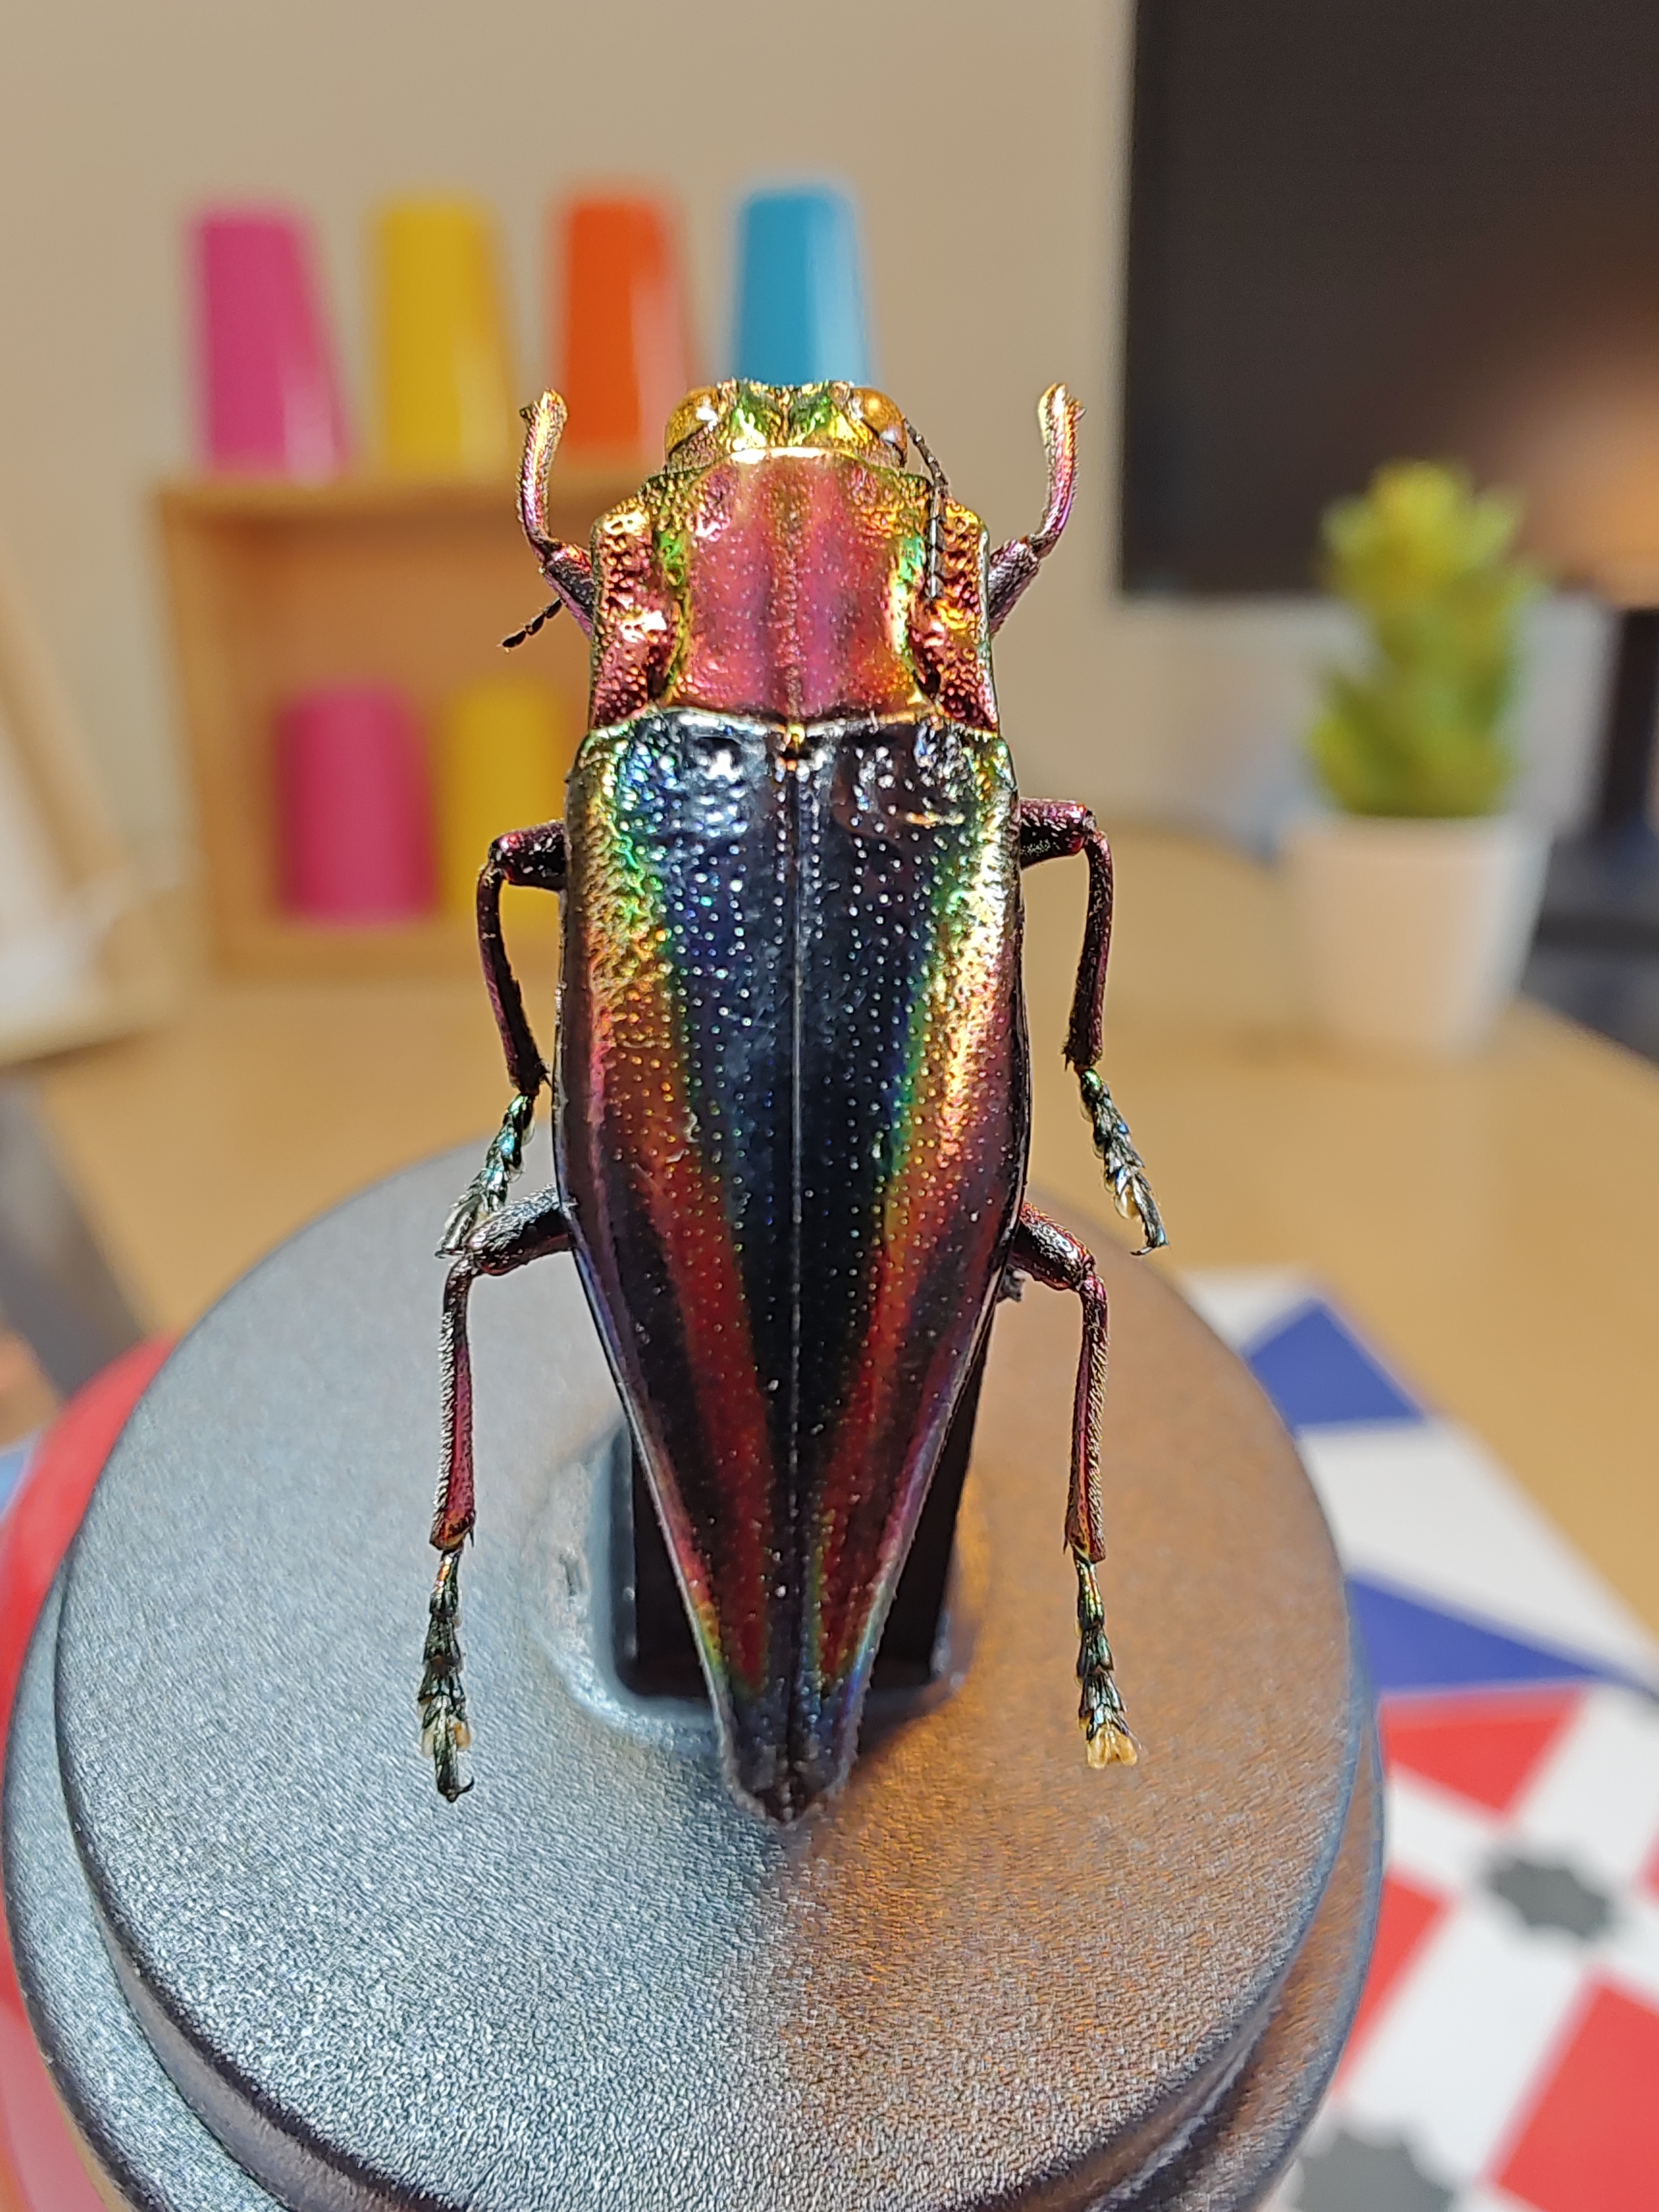
近摄
近摄是 DXOMARK 摄像头测试第 5 版引入的第三个新用例评分,旨在评鉴摄像头在 10 厘米以下和尽可能接近 1:1 的放大倍率下摄入细节的能力。
在我们的测试中,华为 P60 Pro 的超广角和远摄摄像头模块都展现出绝佳的微距功能。两者都能捕捉到丰富的细节,而远摄摄像头还有主体隔离更好及拍摄距离更远的额外优势。使用超广角拍摄填满画面的微距照片必须非常靠近被拍摄的主体,这在拍摄生物时并非完全可行,还必须留意手机的影子不会投射到主体上。因此,超广角微距模式最适合应用在文文件的扫描。以下图示说明使用远摄摄像头的微距能拍摄出更好的微距照片。

曝光
Huawei P60 Pro
130
就技术层面而言,曝光和色彩是拍摄出色照片的关键属性。在曝光方面,我们评鉴的主要属性是各种用例中(如风景、人像或静物)的主要被摄体的亮度。此外,我们也会评鉴图像的对比度和动态范围,例如摄像头在图像的高光位和阴暗地带呈现可见细节的能力。可重复性也很重要,因为它展示了摄像头在同一场景中拍摄多张图像时,提供相同图像的能力。
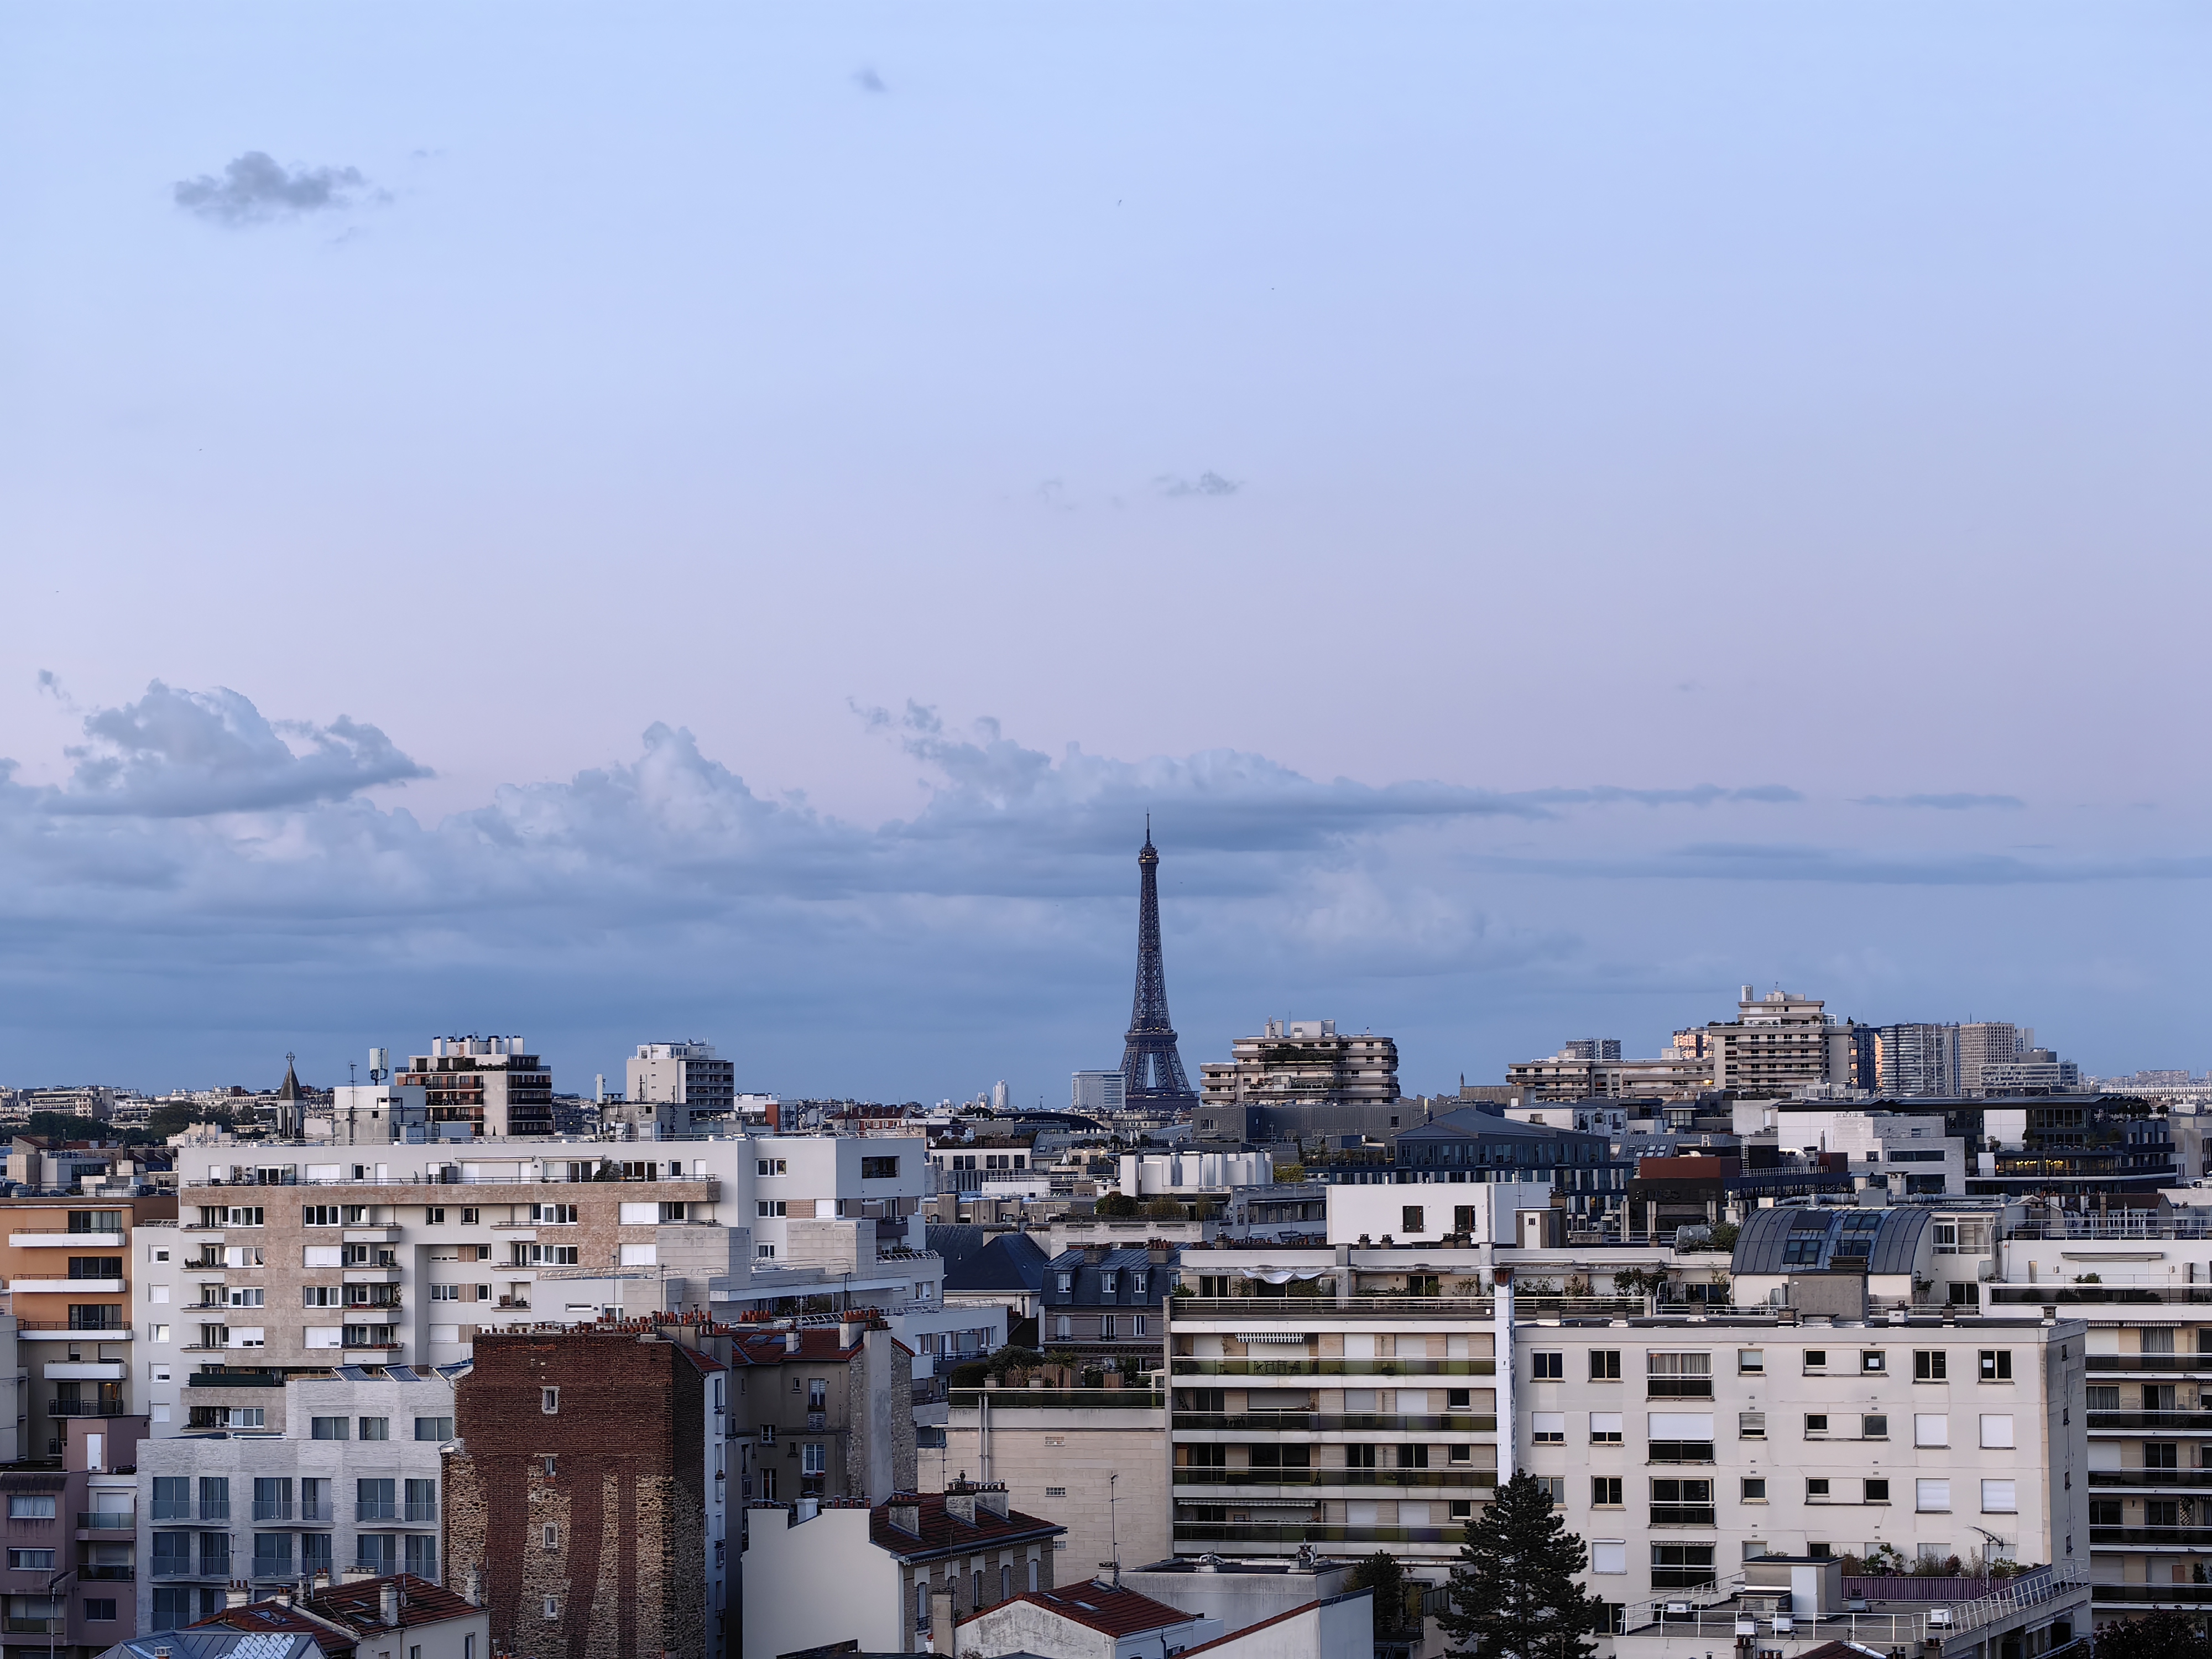
在所有光照条件下,华为 P60 Pro都呈现出良好的主体曝光。无论是在明亮的户外光线还是在低光下,动态范围都很宽广。
相较于竞争机种,在极具挑战性的高对比度条件下,华为 P60 Pro 偶尔会选择比较暗一些的主体曝光,以保持更好的对比度。在这些情况下,目标曝光仍可接受,且摄像头展现出在曝光、动态范围与对比度间出色的平衡取舍。

色彩
Huawei P60 Pro
130
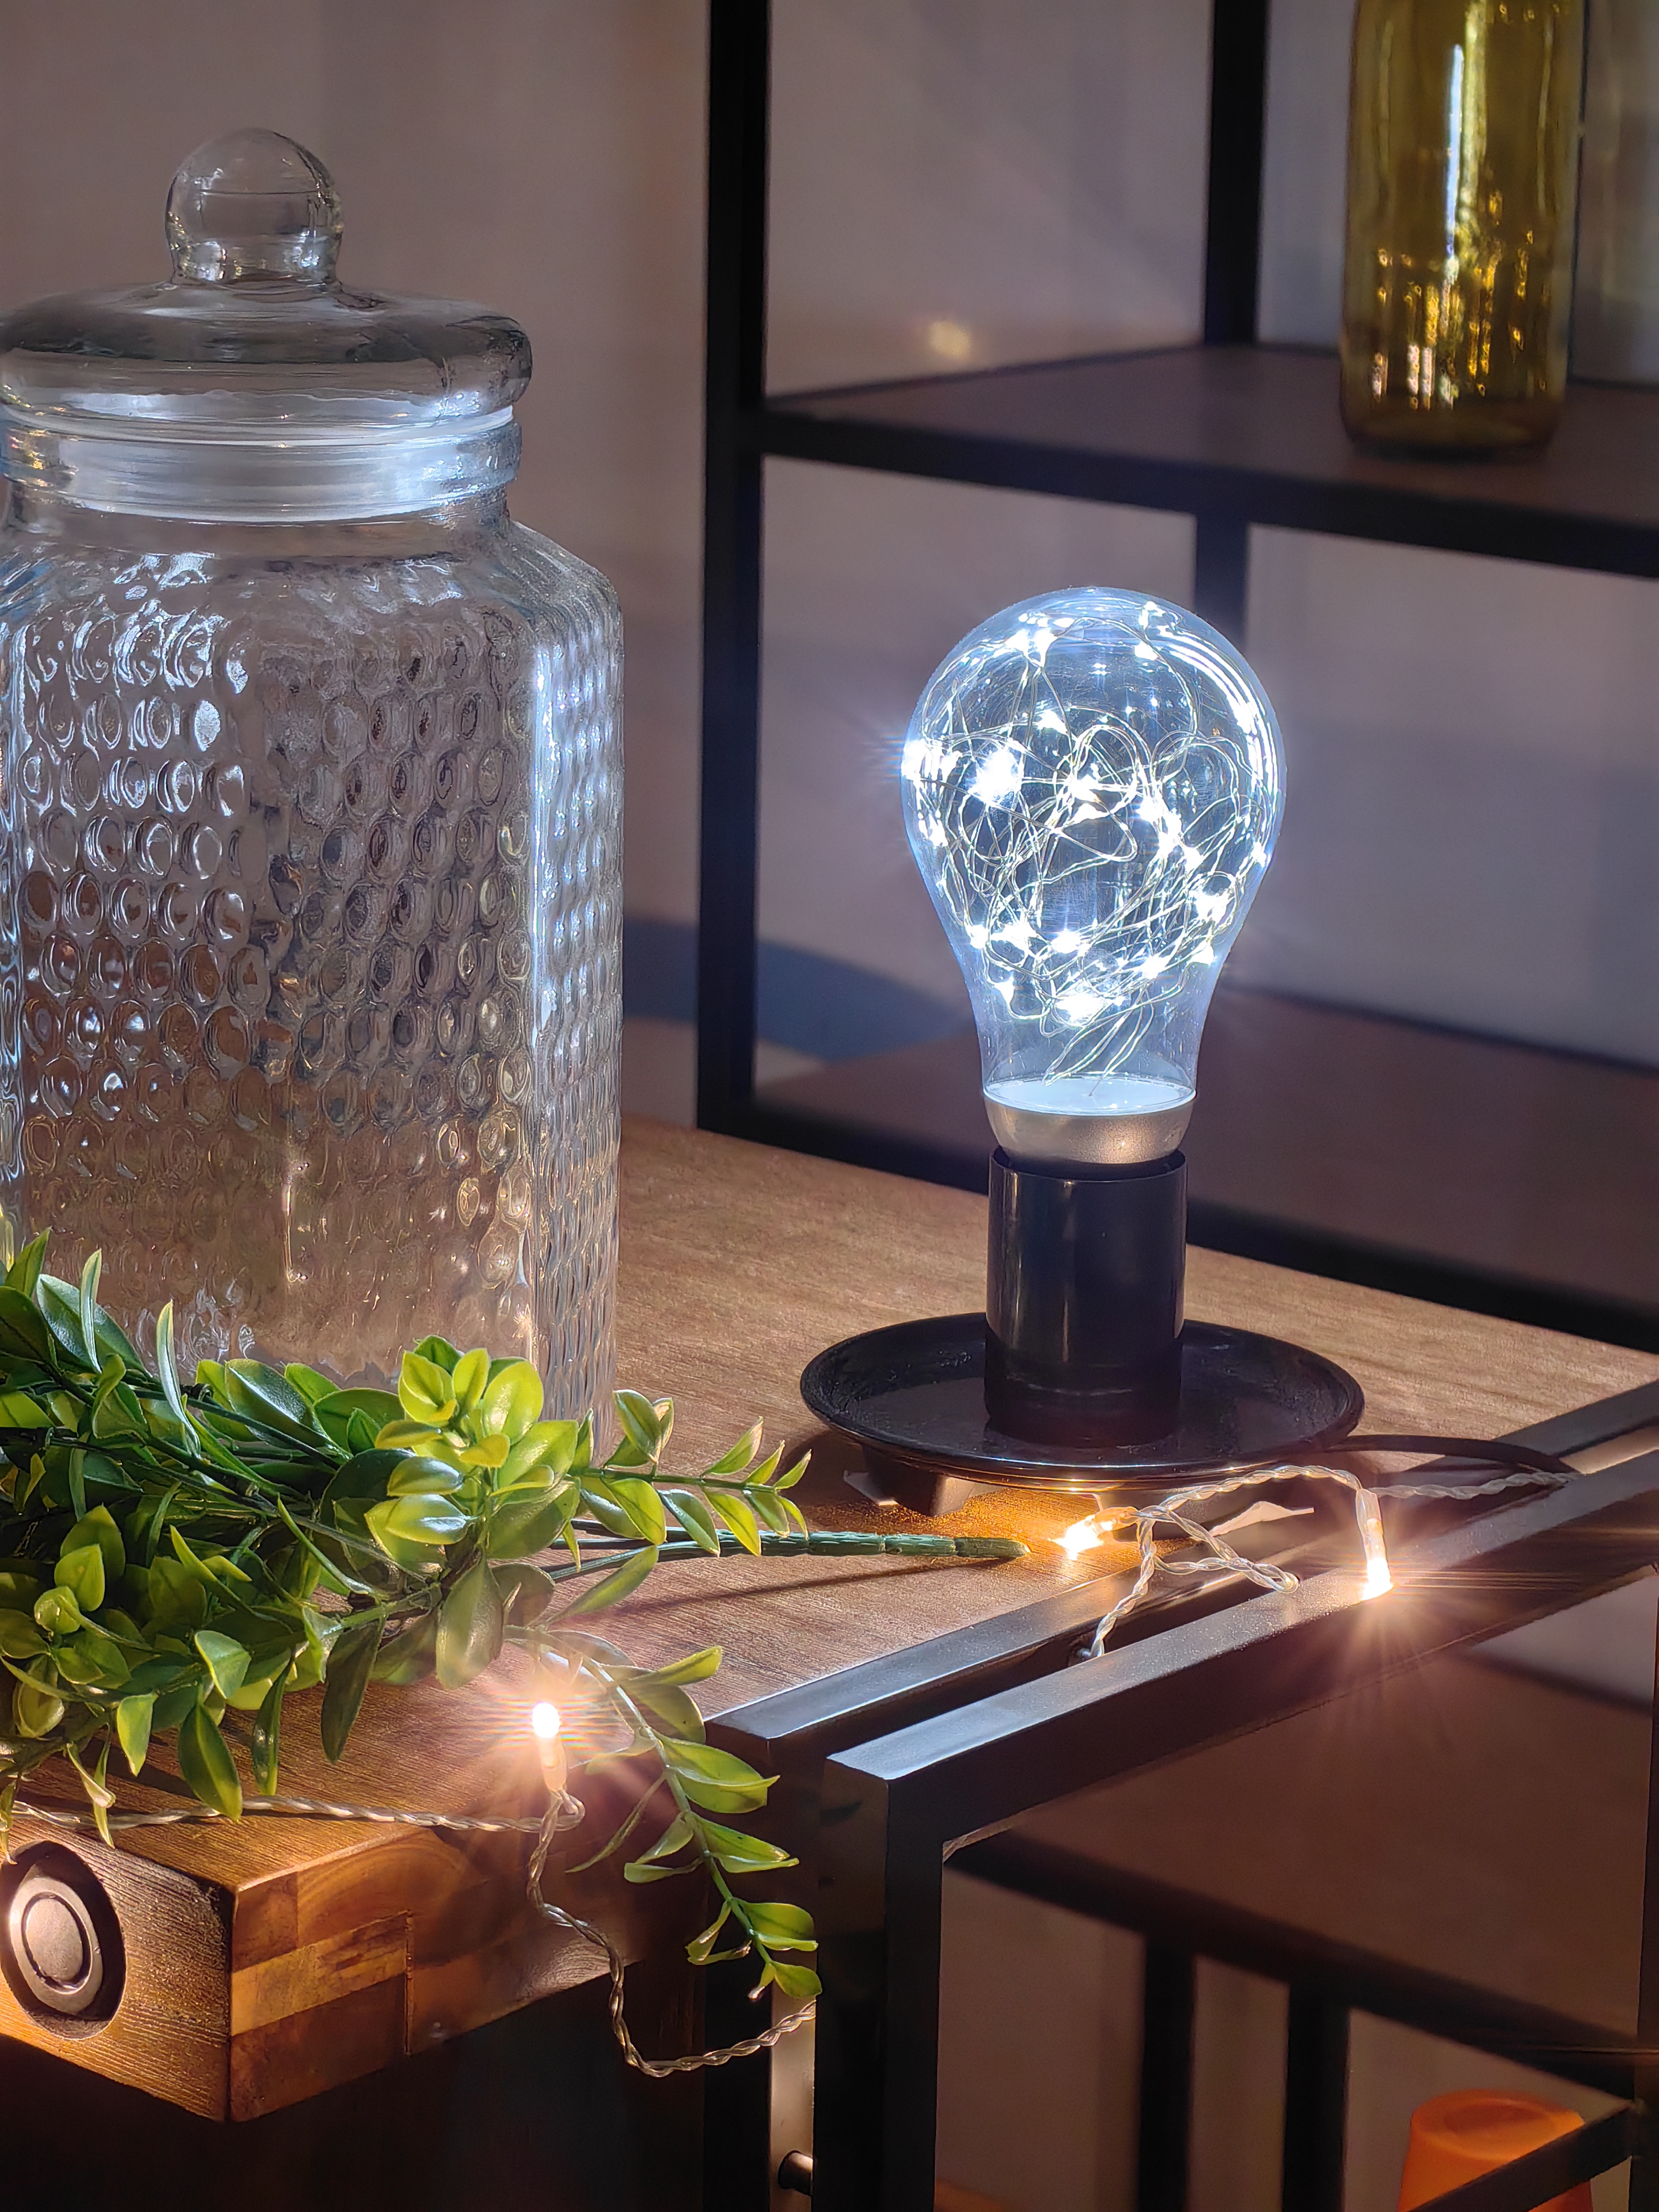
在图像质量的色彩属性方面,我们的分析涵盖肤色呈现、白平衡、彩色渐晕和可重复性。就色彩和肤色呈现而言,我们会针对不自然的色彩而扣分,不过,我们也会尊重制造商对特定色彩的偏好。
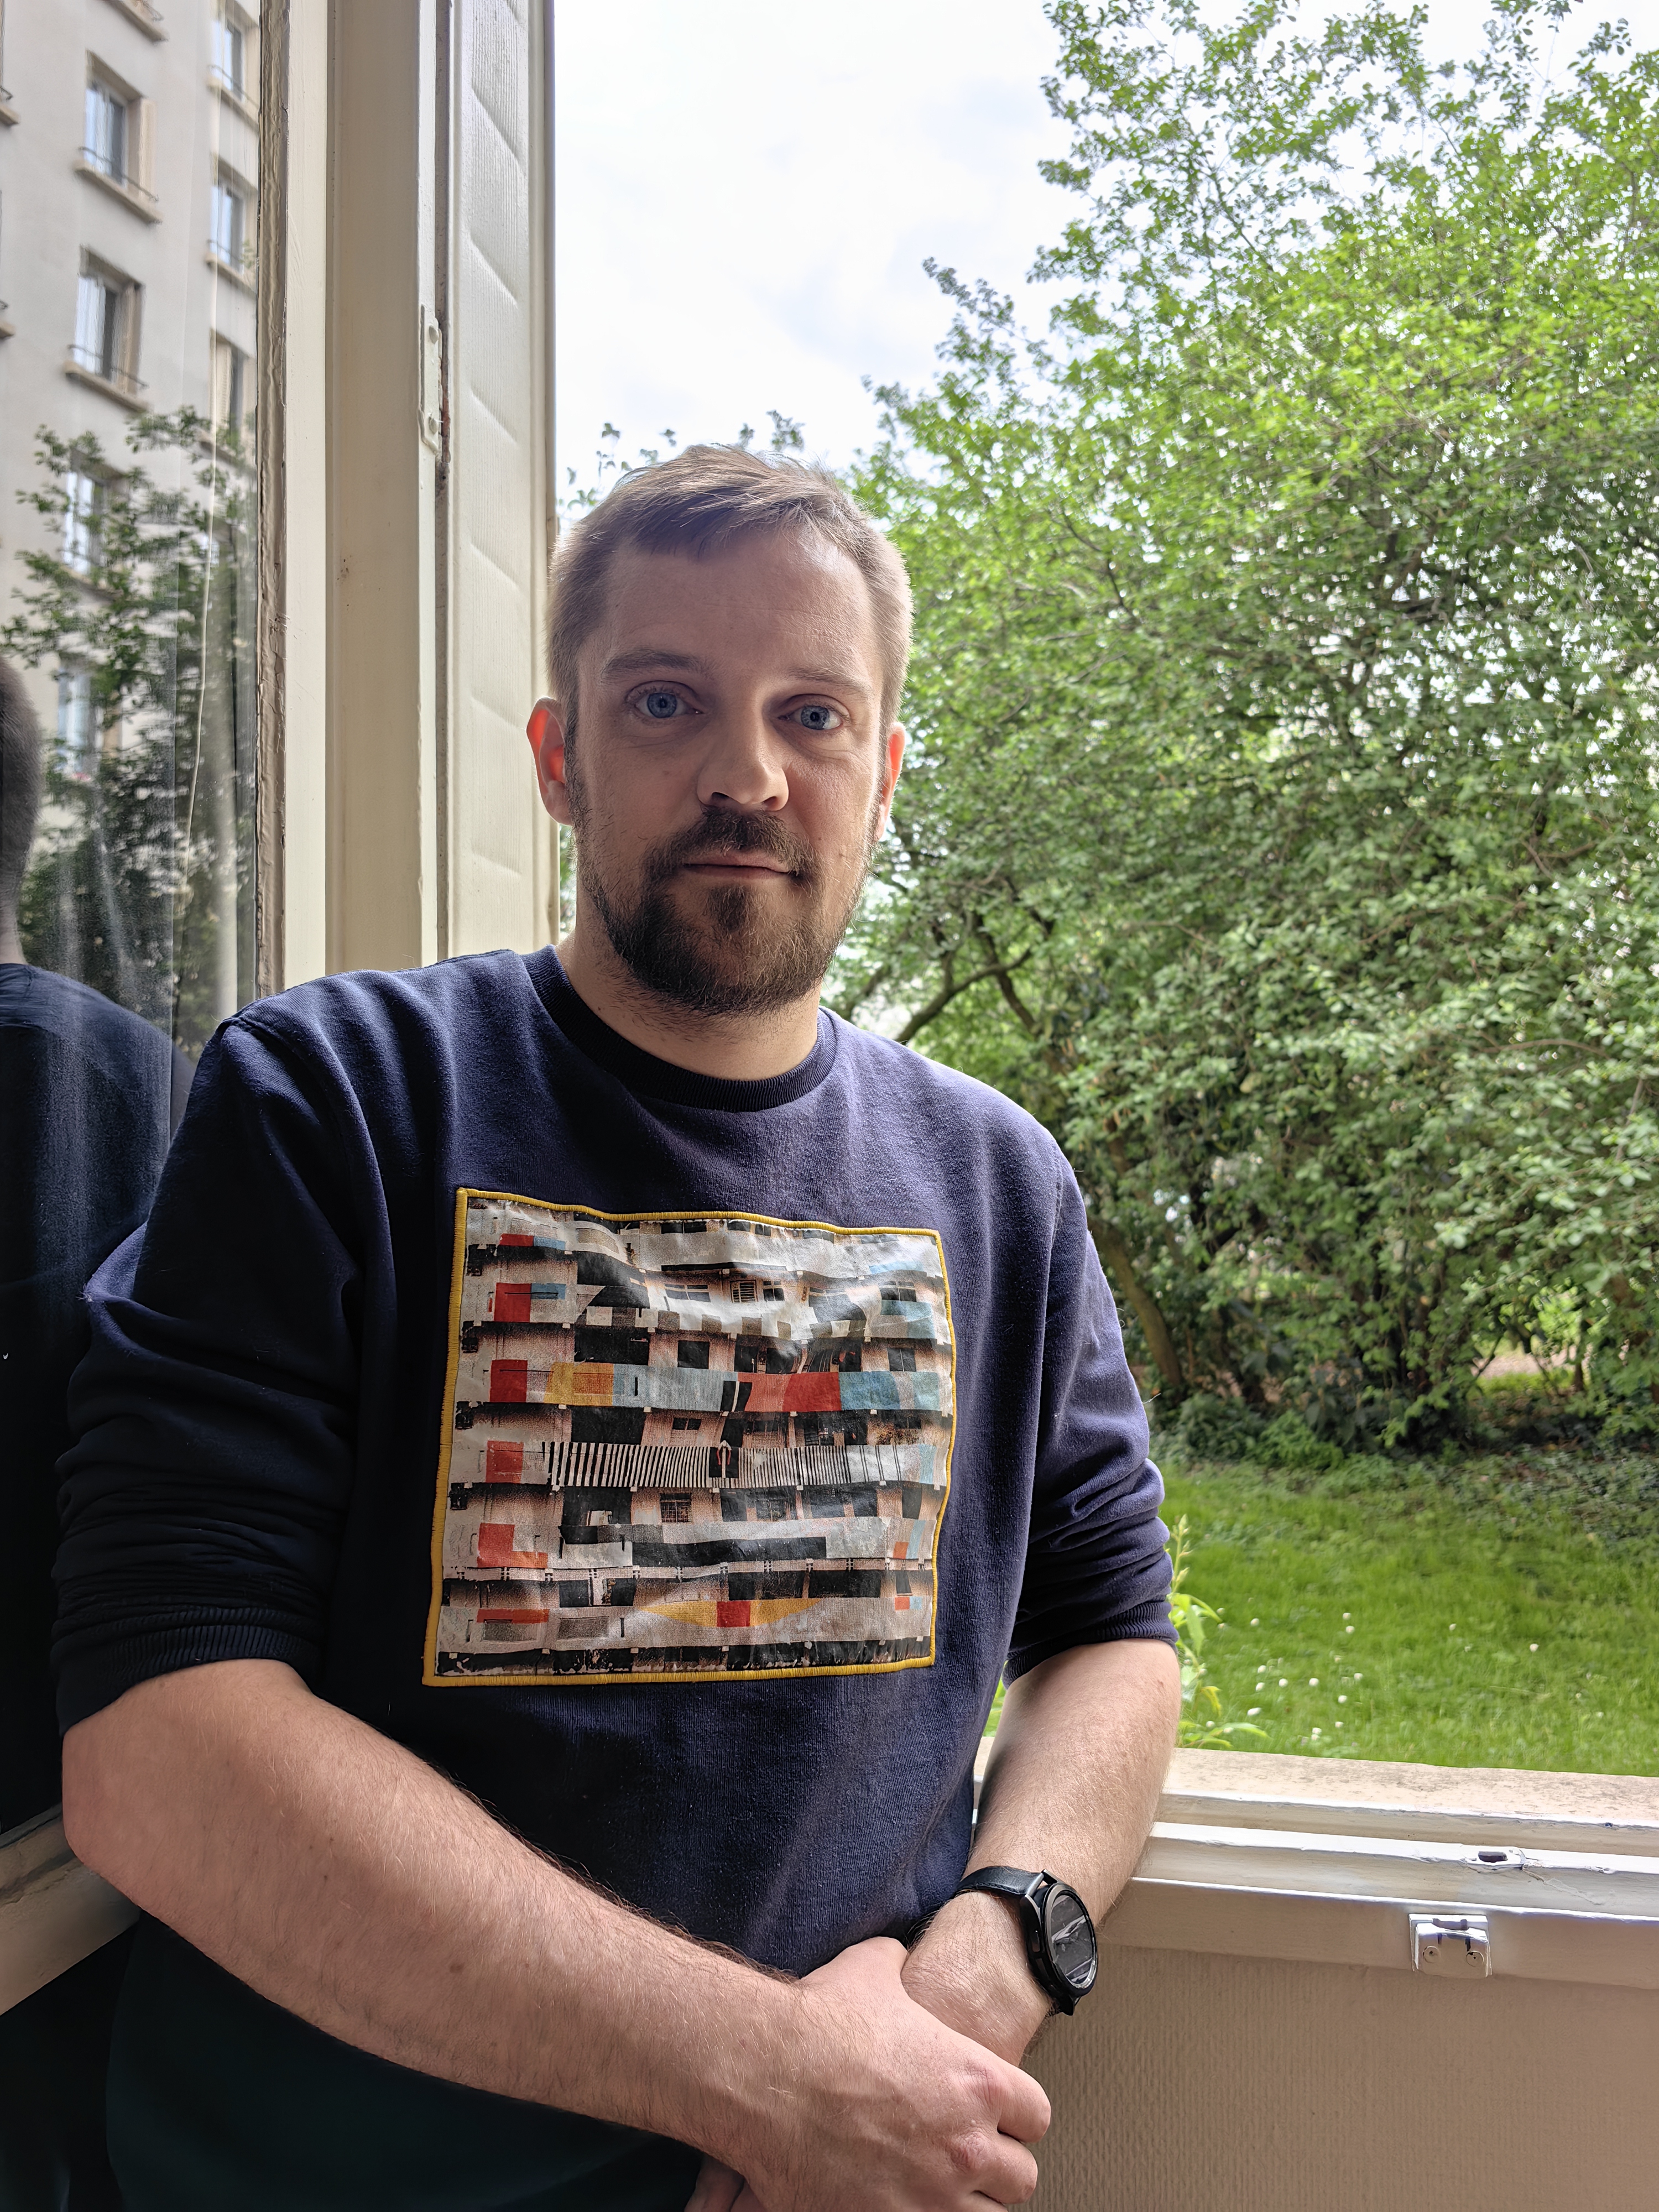
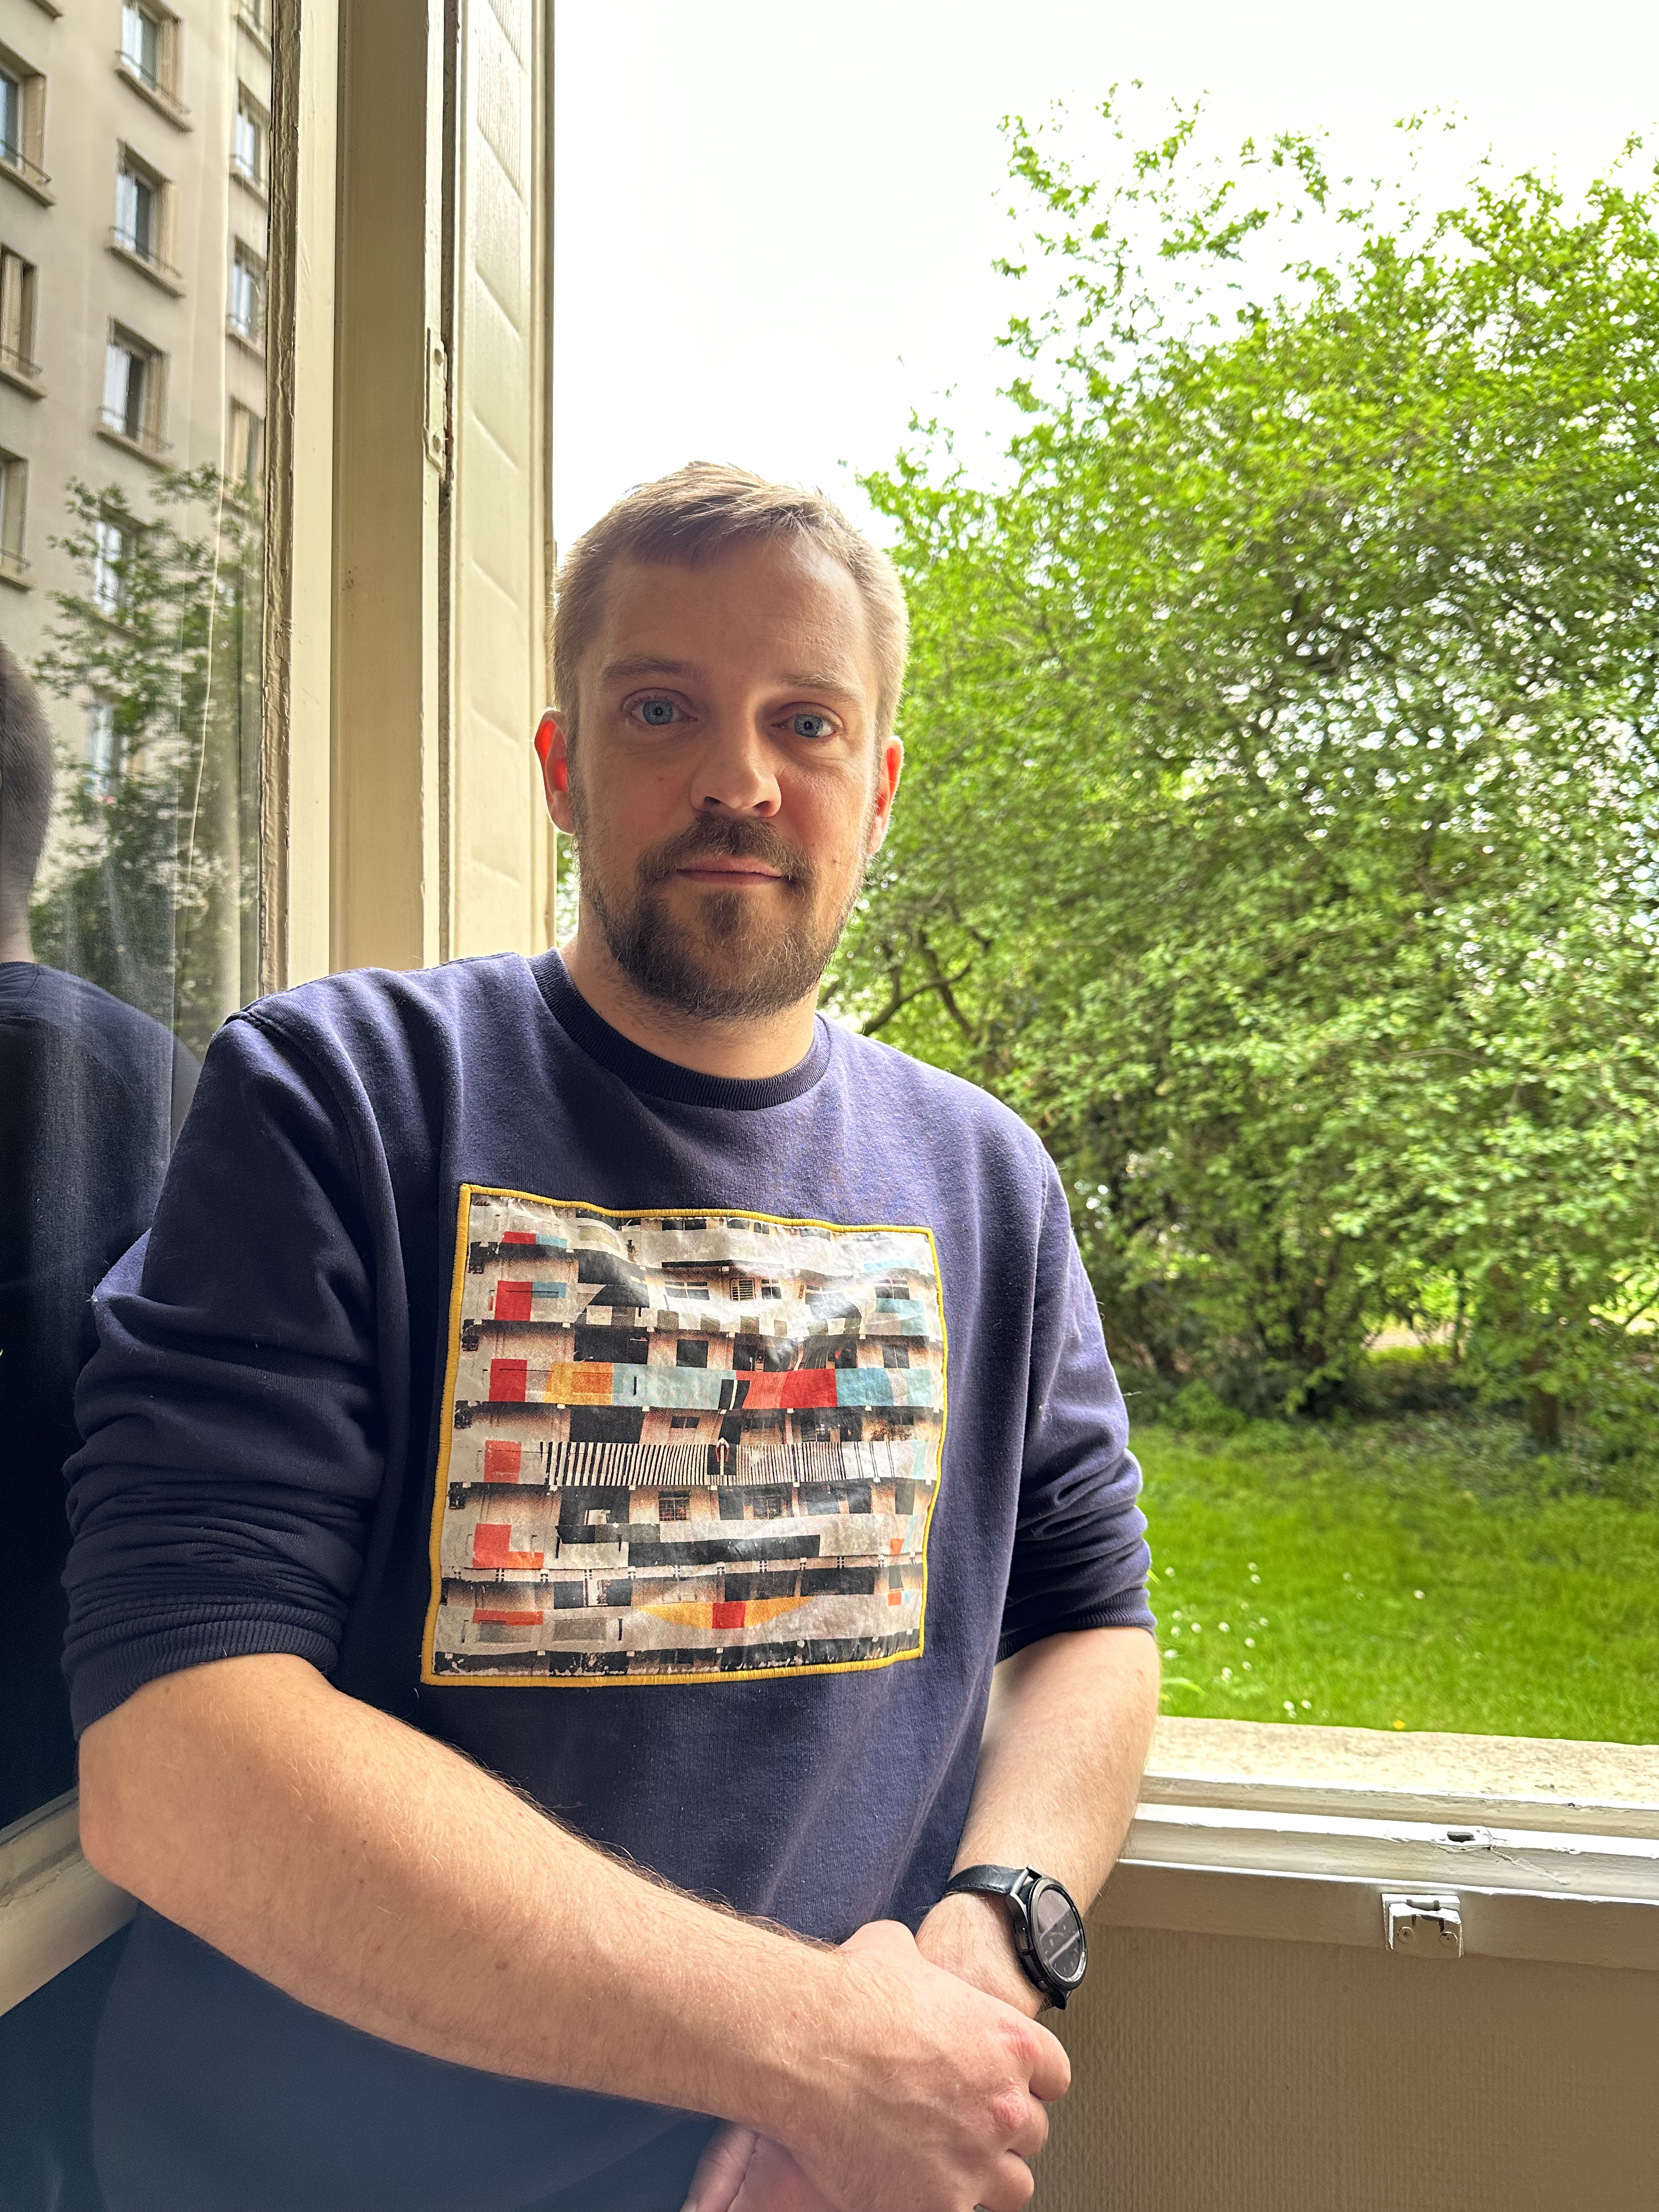
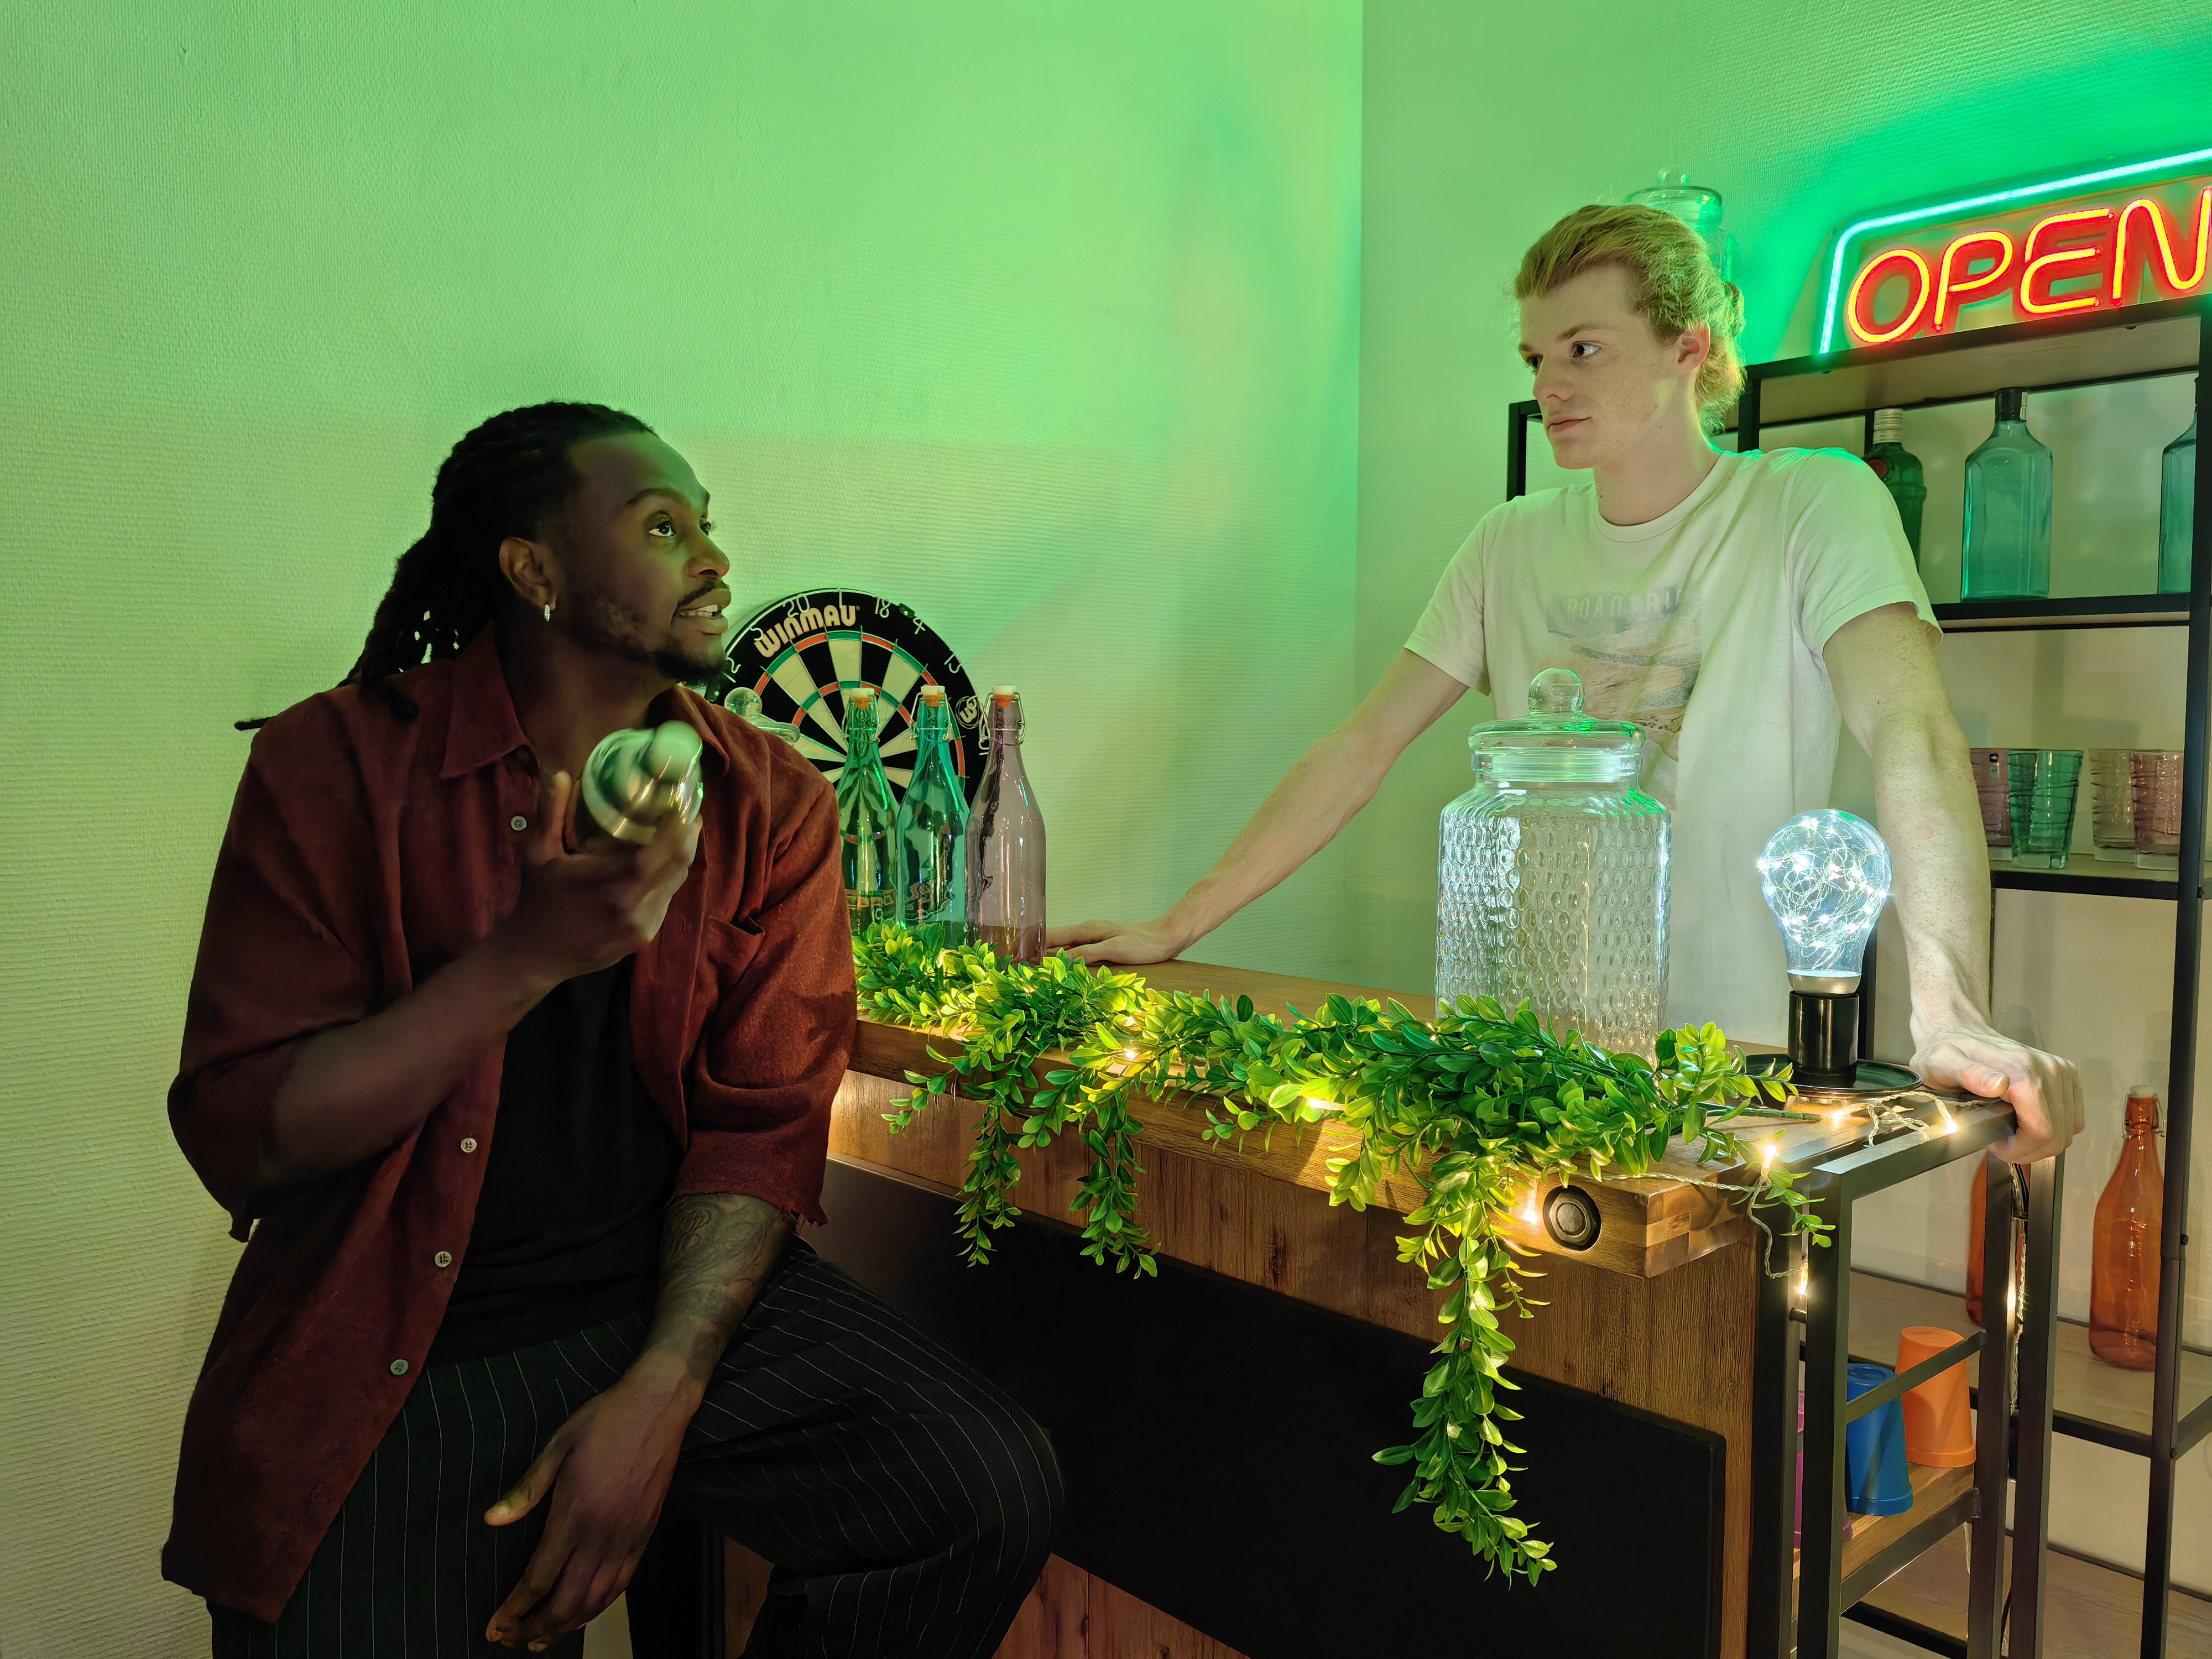
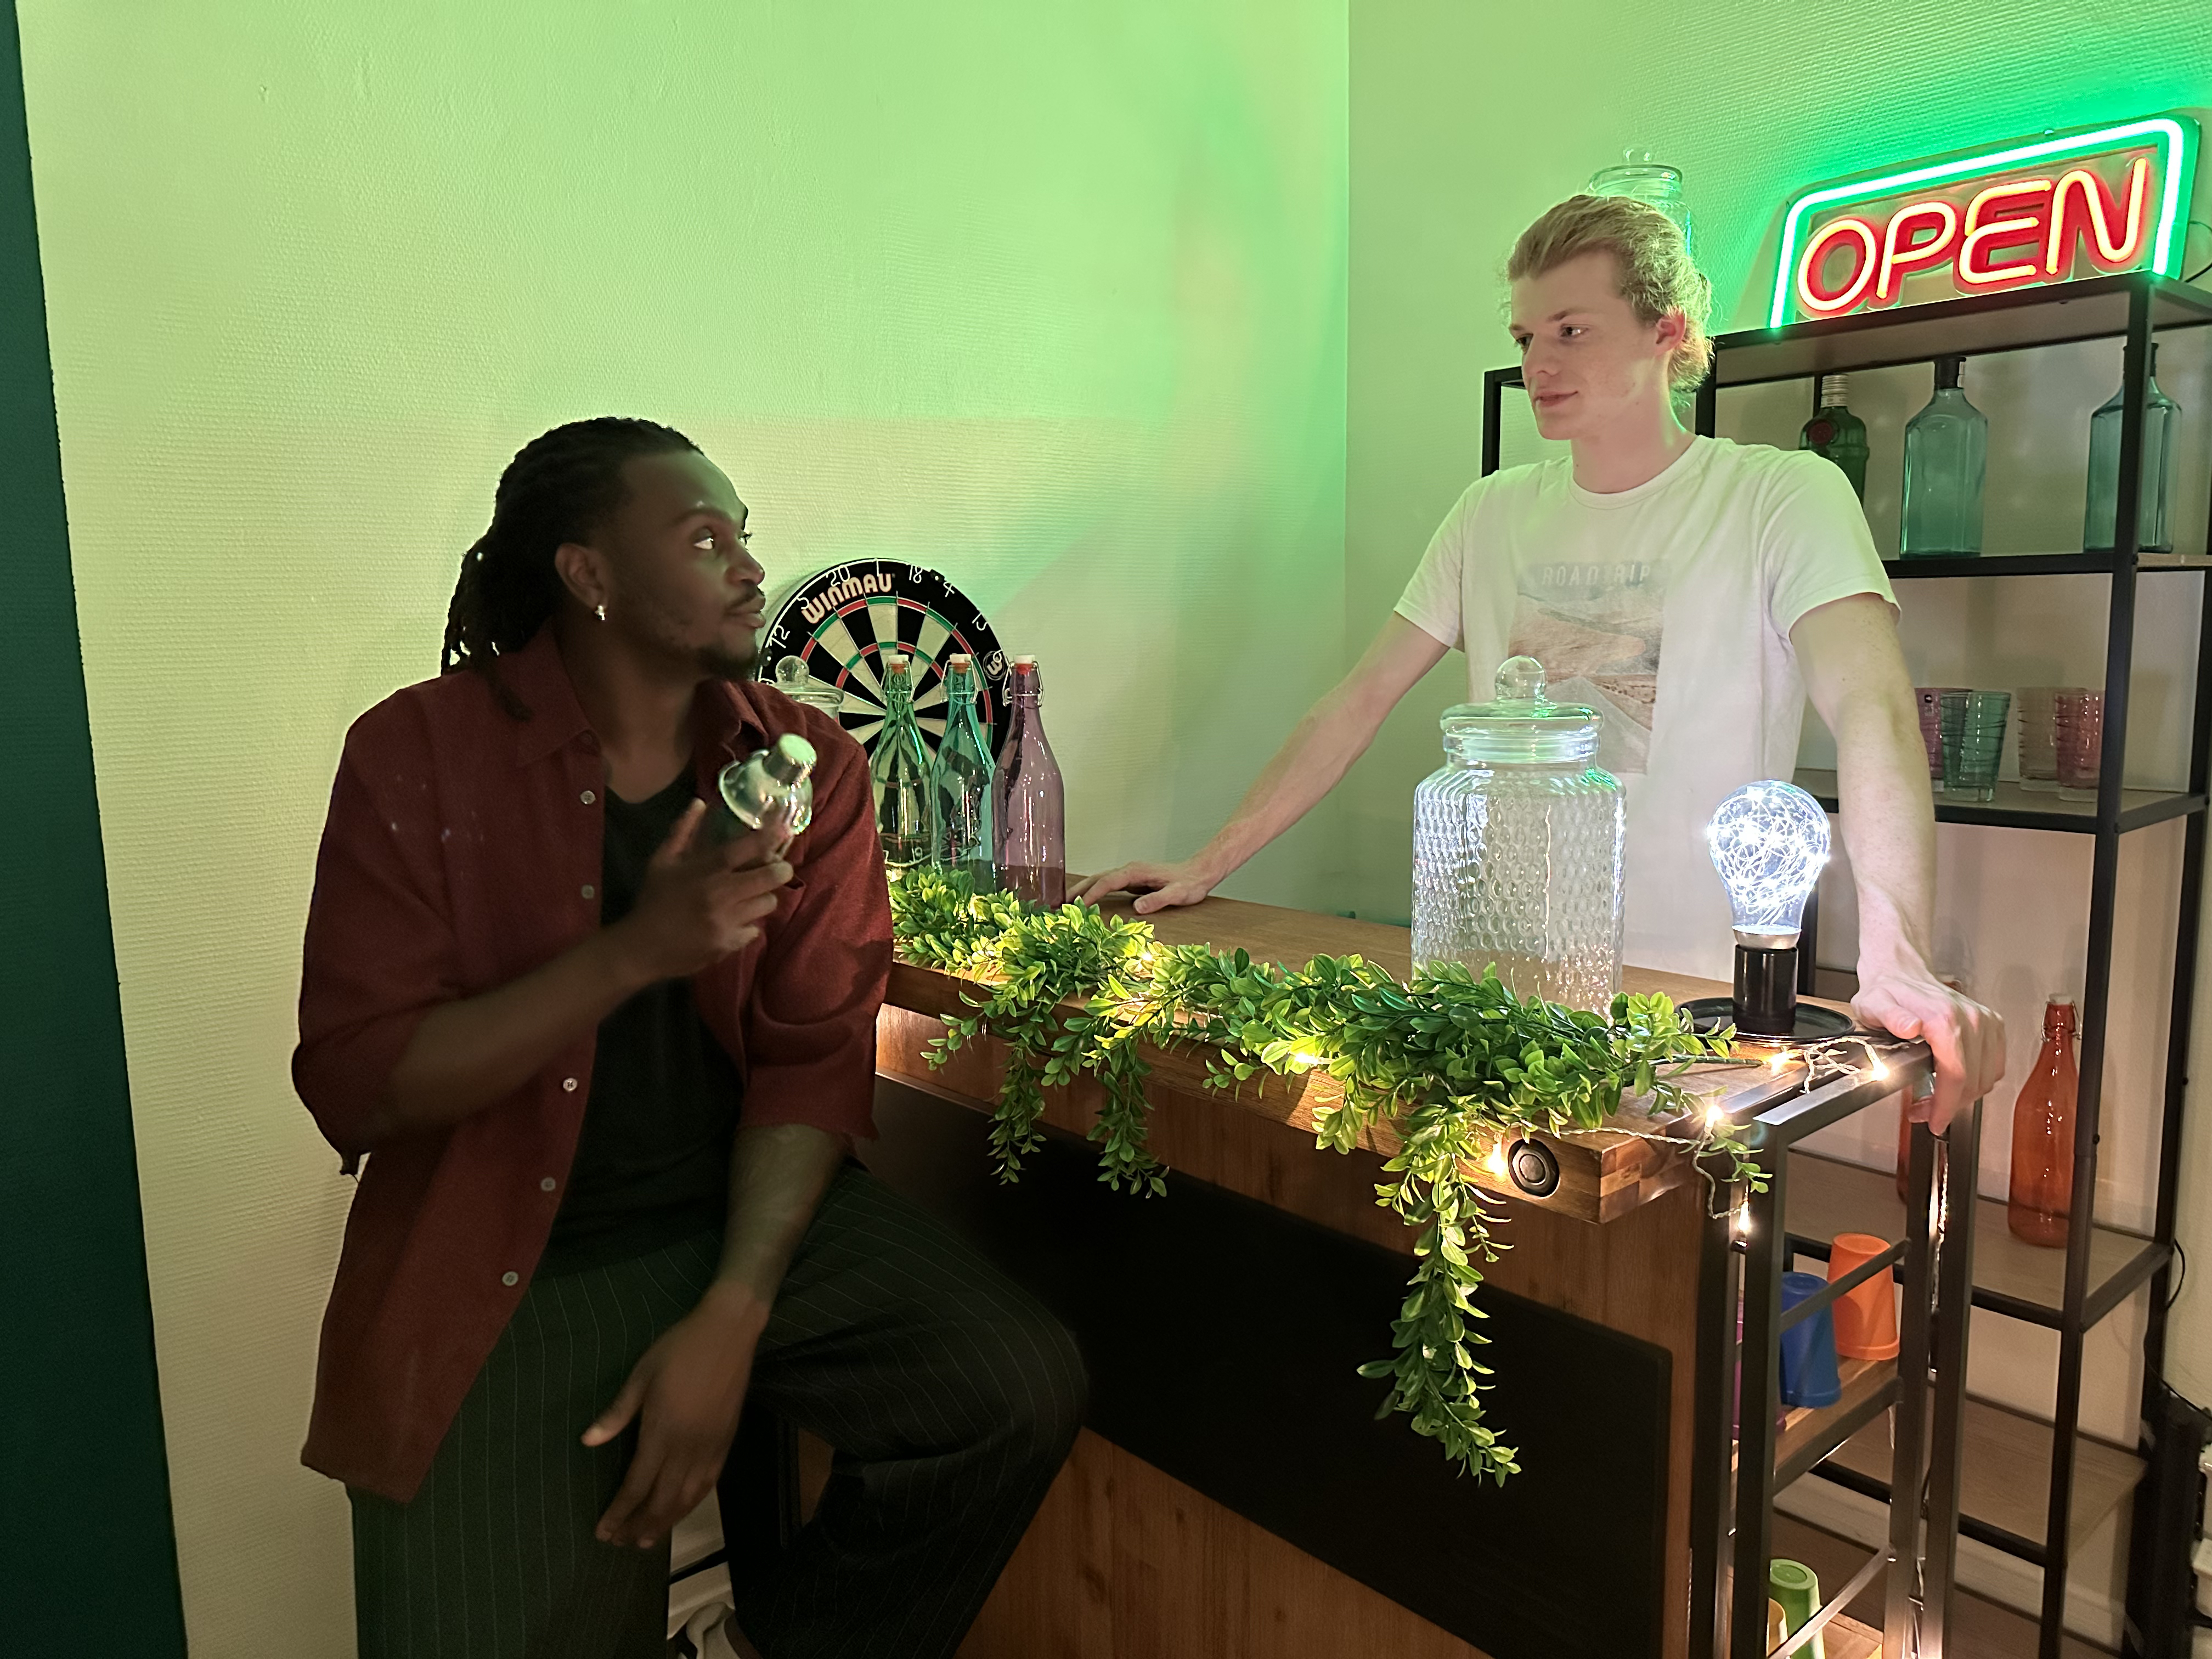
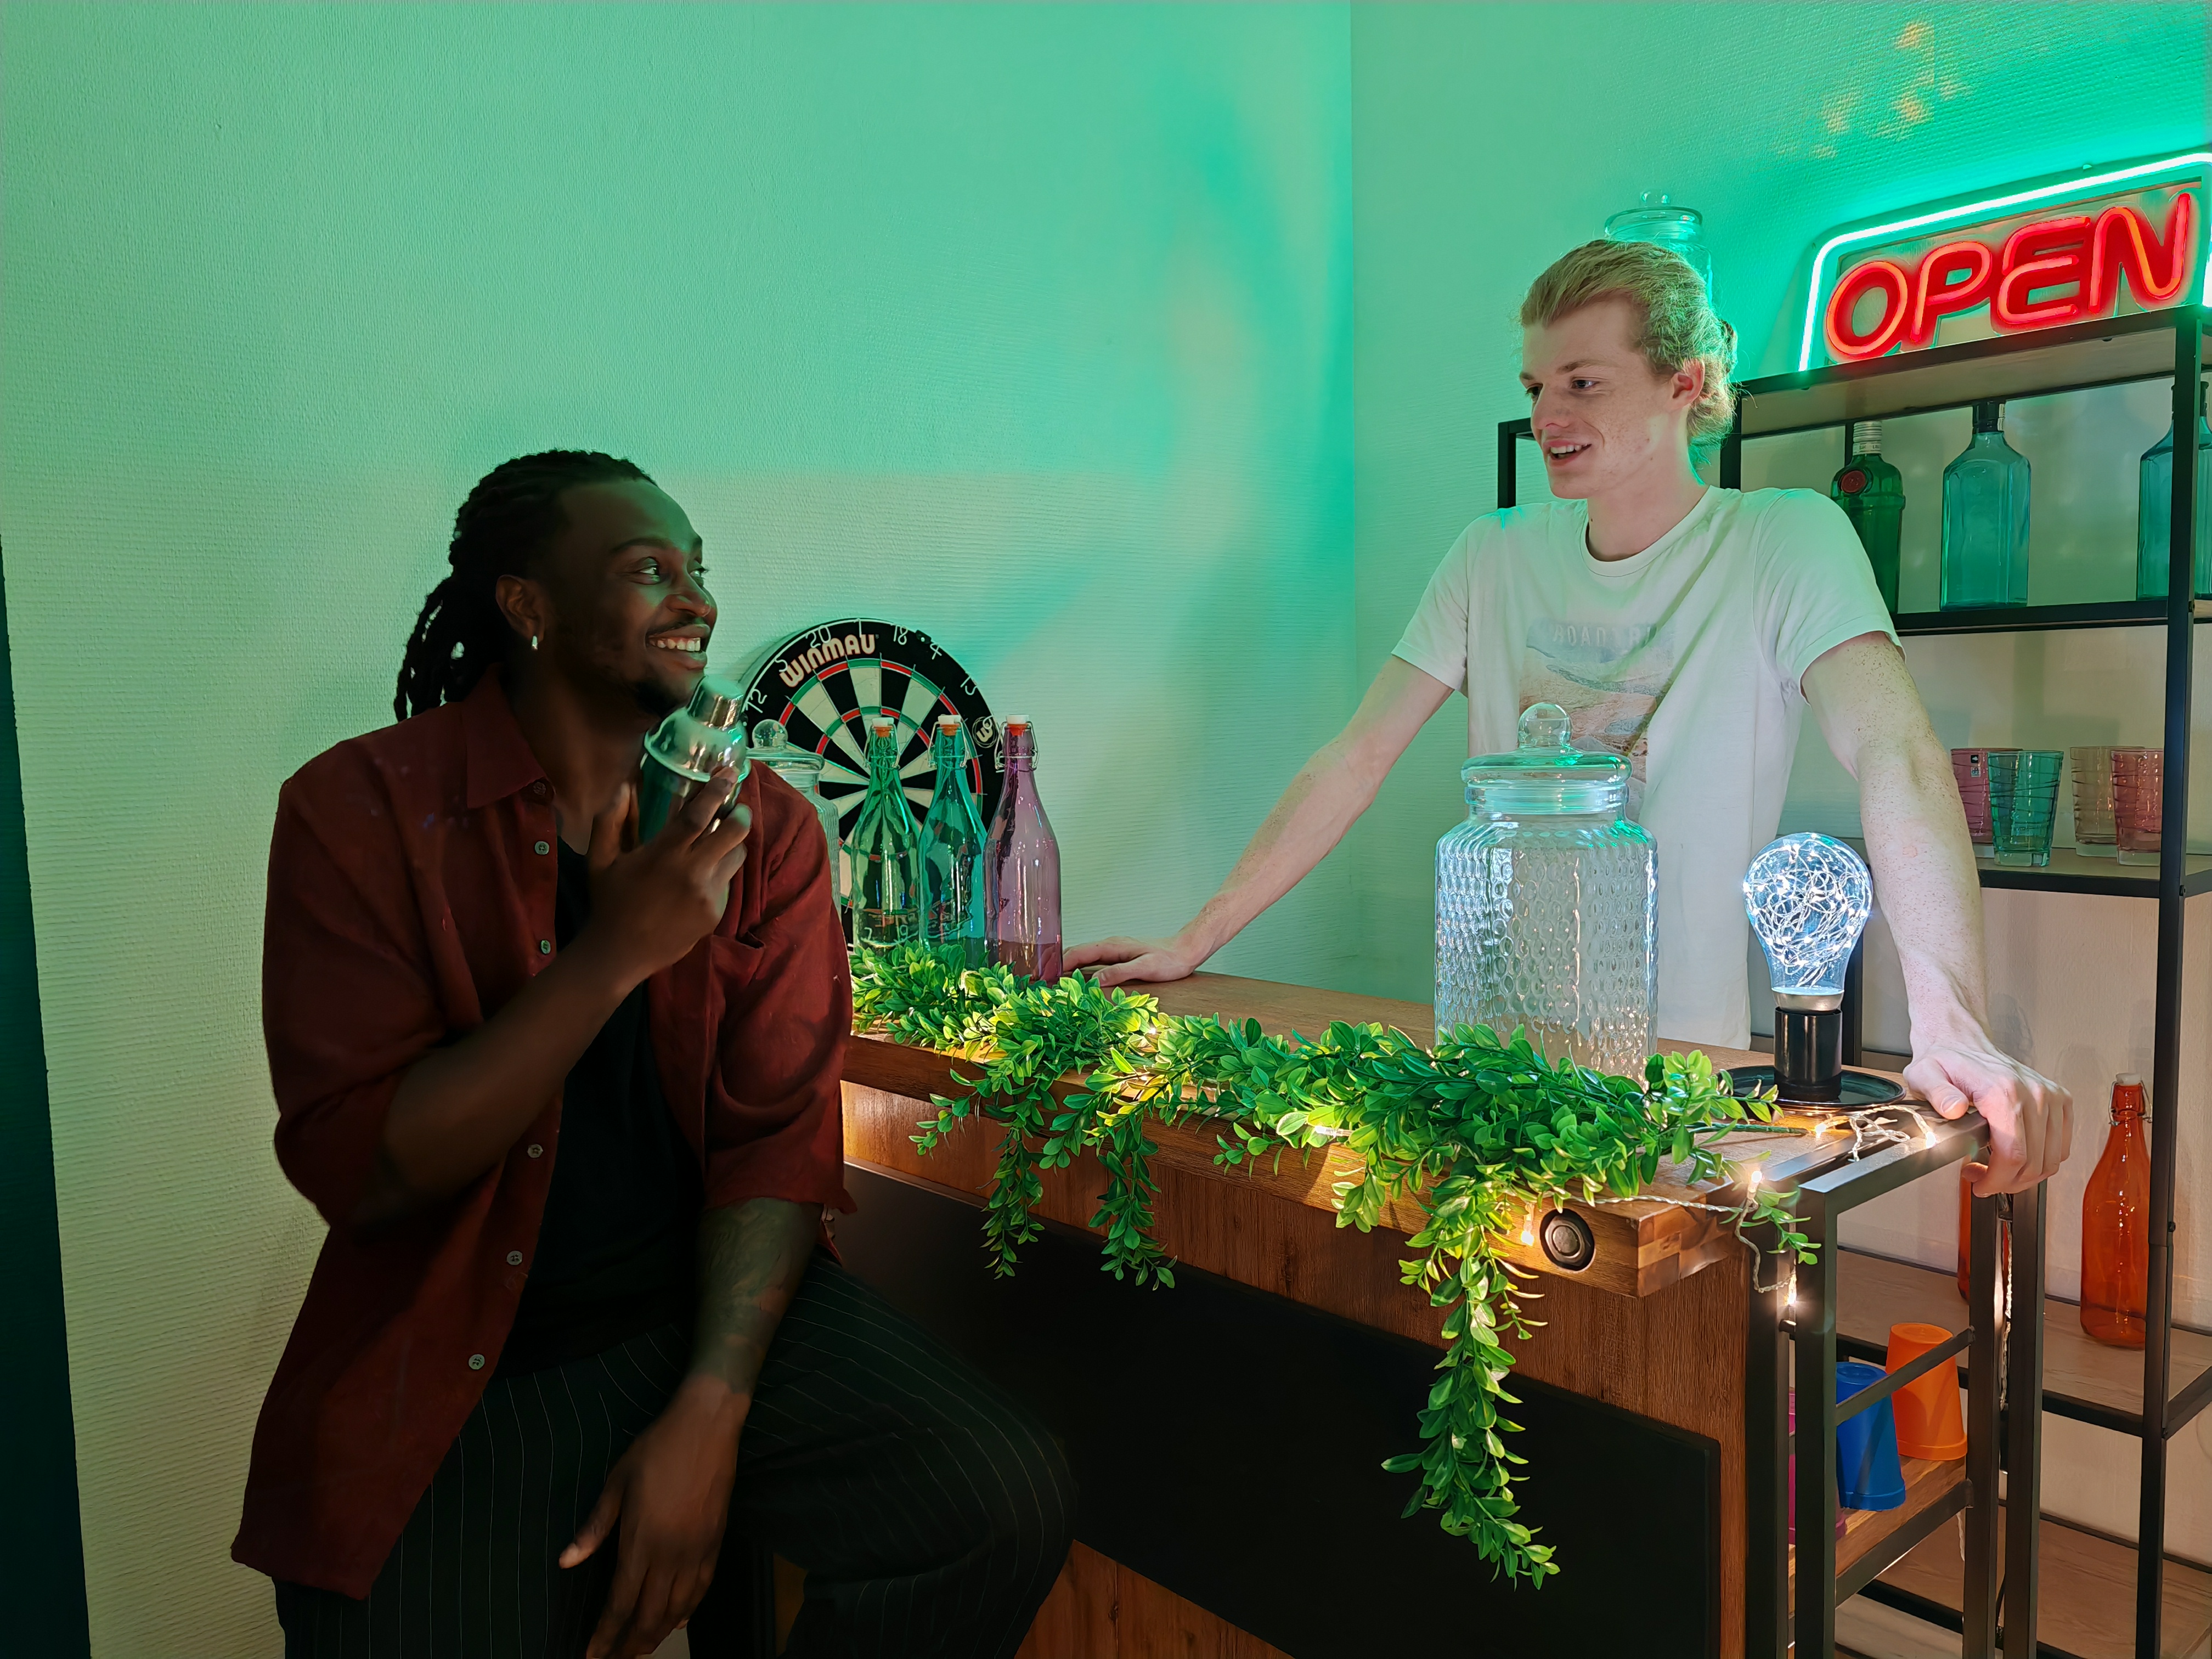
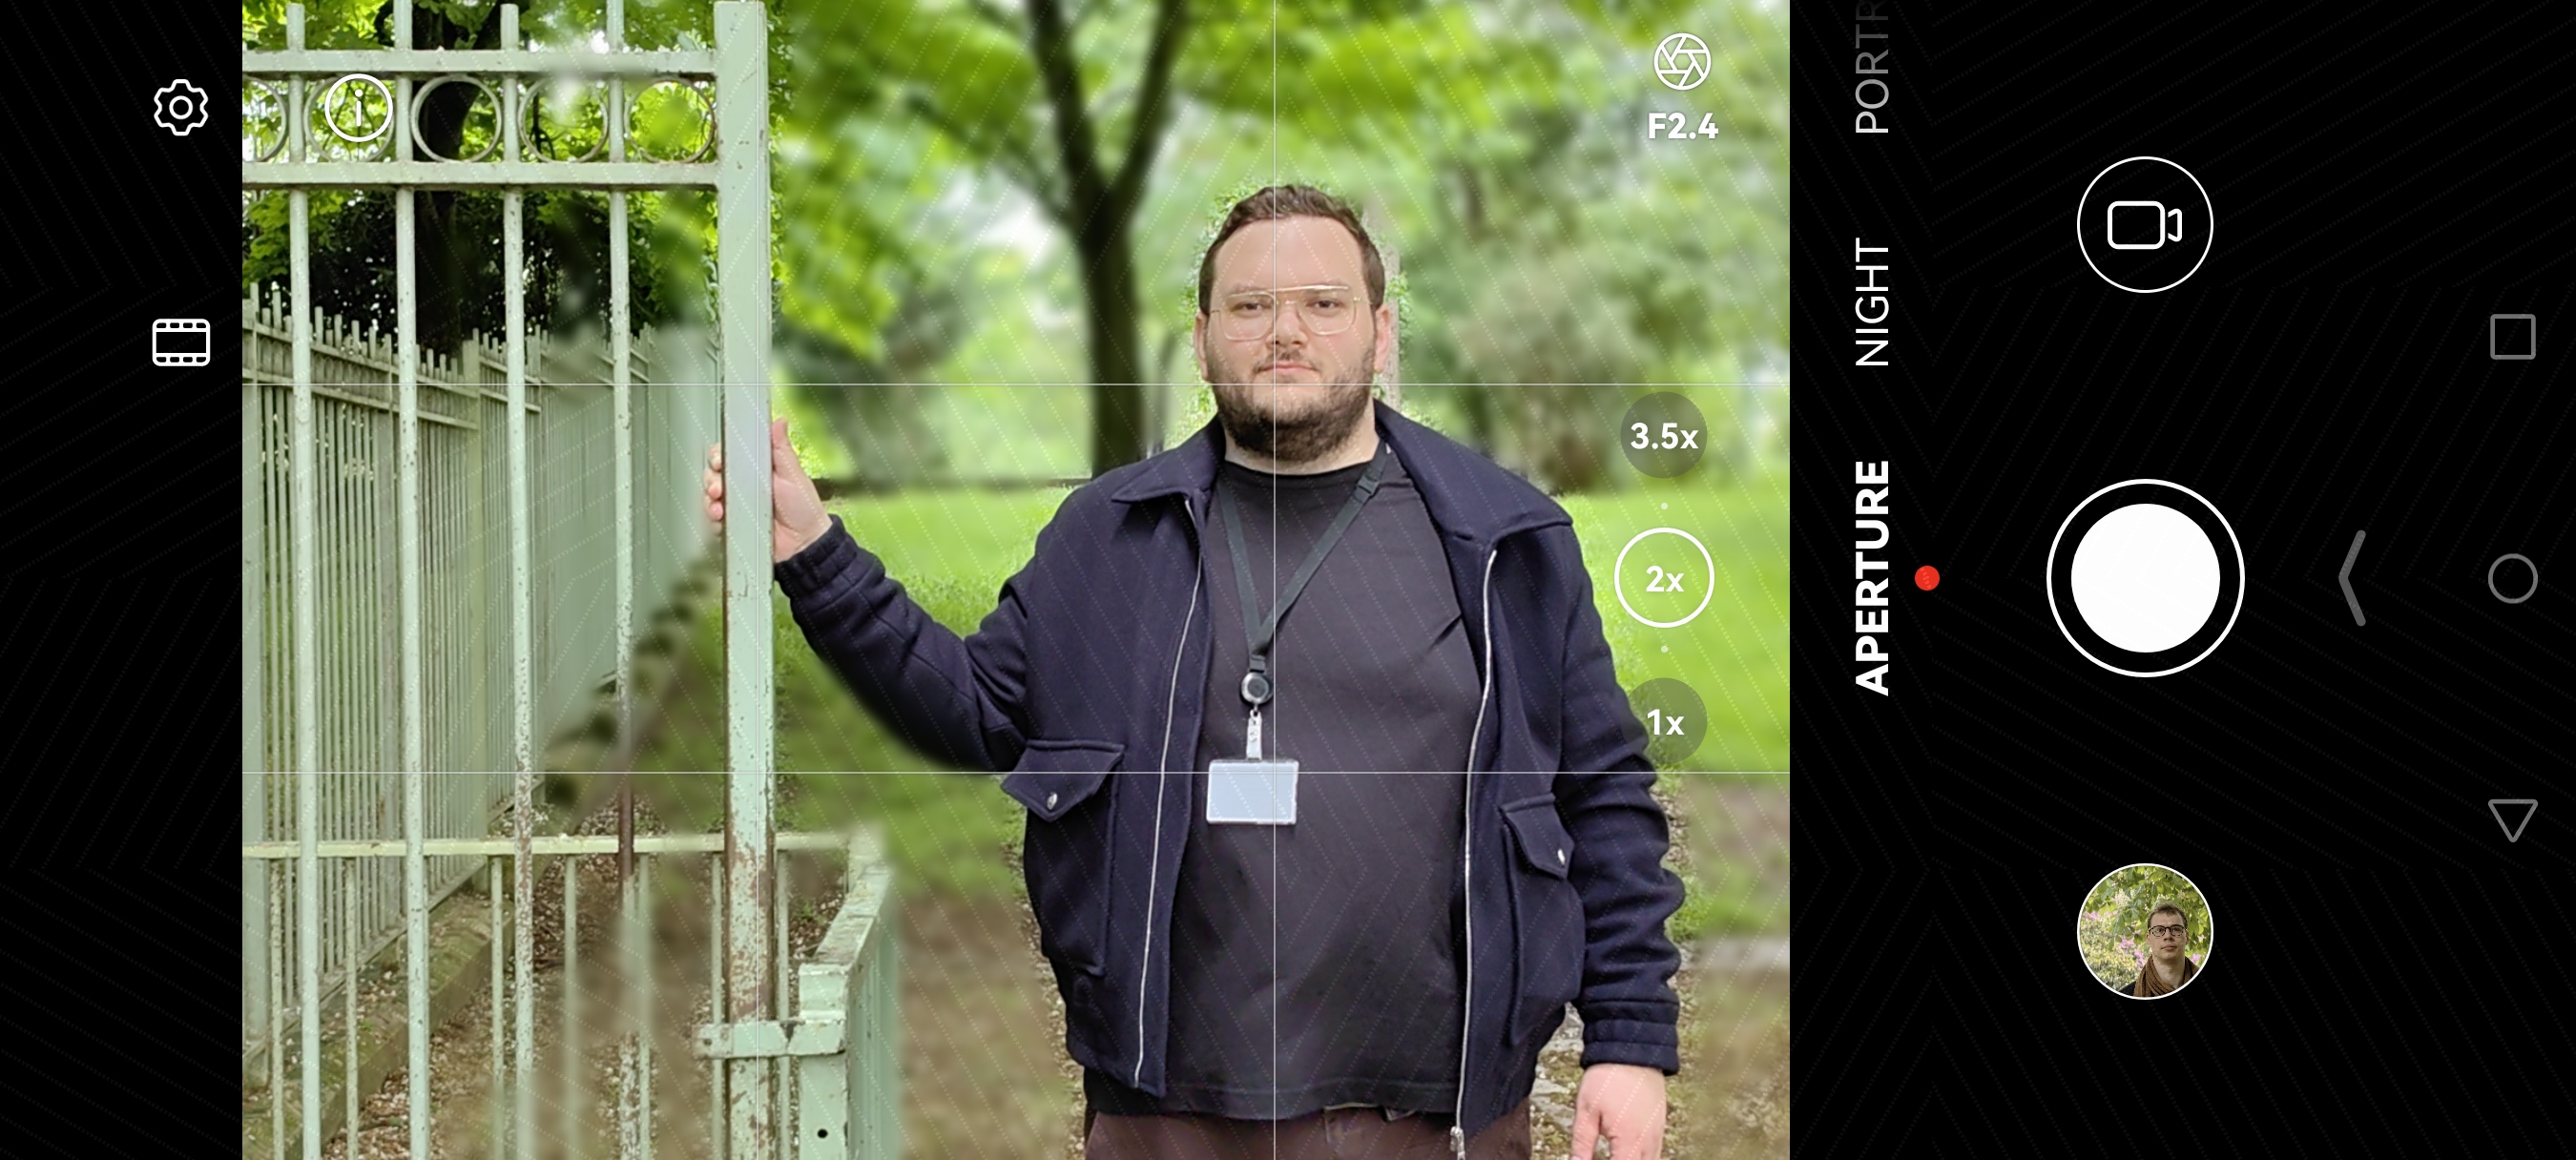
由于大致上为中性白平衡且色彩呈现准确,因此,这款摄像头能拍摄出漂亮的色彩,即使在具挑战性和不寻常的照明条件下也是如此。在下面的图示中,P60 Pro 保持了绿色色偏,与实际的灯光相呼应。
肤色呈现特别出色,大多数不同的肤色以及各种光照条件下都能准确的显现。极少数的情况下,在明亮的户外光线与室内会出现轻微的绿色色偏。


自动对焦
Huawei P60 Pro
125
进行自动对焦测试时,我们着眼于对焦准确性、重复性、拍摄时的时间延迟和景深。拍摄延迟是用户按下拍摄按钮的时间与实际拍摄图像的时间之间的差异,这其中包括手机的对焦速度和在正确时间点上拍摄图像的能力,即所谓的“零快门时滞”能力。虽然在单人人像或特写镜头中,浅景深可以拍出宜人的效果,但在某些特定条件下(例如拍摄集体合照时)却可能变成一大问题;我们会在两种情况中测试摄像头的表现。我们也会评鉴摄像头在现实生活中,以及在低光到户外等不同光照条件下,拍摄各种图像时的对焦准确性。对焦范围涵盖无限远处到特写的近距离物体。
在我们的测试中,华为 P60 Pro 的自动对焦快速、准确且可靠。 由于零延迟快门,所以很容易捕捉到移动场景中决定性的瞬间。 即使在极低光下,这款摄像头依旧保持着敏捷性,也成为棘手条件下拍摄的绝佳选择。
得益于其 F1.4-F4.0自动可调物理光圈,华为 P60 Pro 能够在有需要的场景显著扩大景深,这能让团体照中位于不同平面上的所有主体都可以有很好的清晰度。


纹理
Huawei P60 Pro
125
在纹理测试中,我们分析在实验室和现实生活场景中拍摄的图像中的被摄体细节水平和纹理。在自然场景照片中,我们特别注意图像的高光位和阴暗区域的细节水平。我们在 1 到 1000 勒克斯之间的各种照明条件以及不同类型的动态范围条件下对着图片进行拍摄,并对所拍摄的图像进行客观测量。拍摄图片时,我们使用 DXOMARK 专有的图片 (DMC) 和枯叶图。
相较于超高端机种中大多数的竞争对手(包括 iPhone 14 Pro),华为 P60 Pro能够呈现出更好些的精细细节以及更佳的清晰度。所有光照条件下的纹理呈现都相当一致,即使低光下也能捕捉到良好的细节。然而,在最具挑战性的场景进行拍摄时,华为P60 Pro会丢失一些局部细节,还有些许的过度锐化也是可以注意到的。


此外,华为 P60 Pro 拍摄定格动作的效果优于大多数竞争对手,即使是低光场景中移动的主体,也能捕捉到清晰的图像。

噪点
Huawei P60 Pro
117
在噪点测试中,我们分析在现实生活中和在实验室图片上拍摄的图像噪点的各种属性,例如强度、色度、颗粒和结构。就自然图像而言,我们特别注意面部、风景以及阴暗区域和高动态范围条件下的噪点。我们也会评鉴自然图像中的运动物体上的噪点。我们在 1 到 1000 勒克斯之间的各种照明条件以及不同类型的动态范围条件下对着图片进行拍摄,并对所拍摄的图像进行客观测量。我们使用枯叶图并进行标准化的测量,例如源自 ISO 15739 的视觉噪点。
P60 Pro图像中的噪点控制得不错,几乎看不出来。低光场景下的阴暗区域和纯色区域可能会出现一些亮度和低频色度噪点,不过,纹理区域和主体上的噪点控制得当,将干扰降到最低。


伪像
Huawei P60 Pro
82
进行伪像评鉴时,我们着眼于镜头渐晕、色像差、几何畸变、边缘振铃、晕轮、重影、量化、意外的色相偏移等照片可能遭受的非自然性的影响。伪像越严重,越频繁,所扣分数就越多。下面列出我们观察的主要伪像和相应的扣分。
P60 Pro 的图像中通常没有不必要的图像伪影。不过,某些场景的图像质量可能会稍微受到耀斑的影响。在具有挑战性的场景中也看得到一些融合和脸部渲染伪像,这与竞争机种的表现差不多。往好的方面来说,振铃伪像比大多数其他旗舰手机明显来得少


散景
Huawei P60 Pro
85
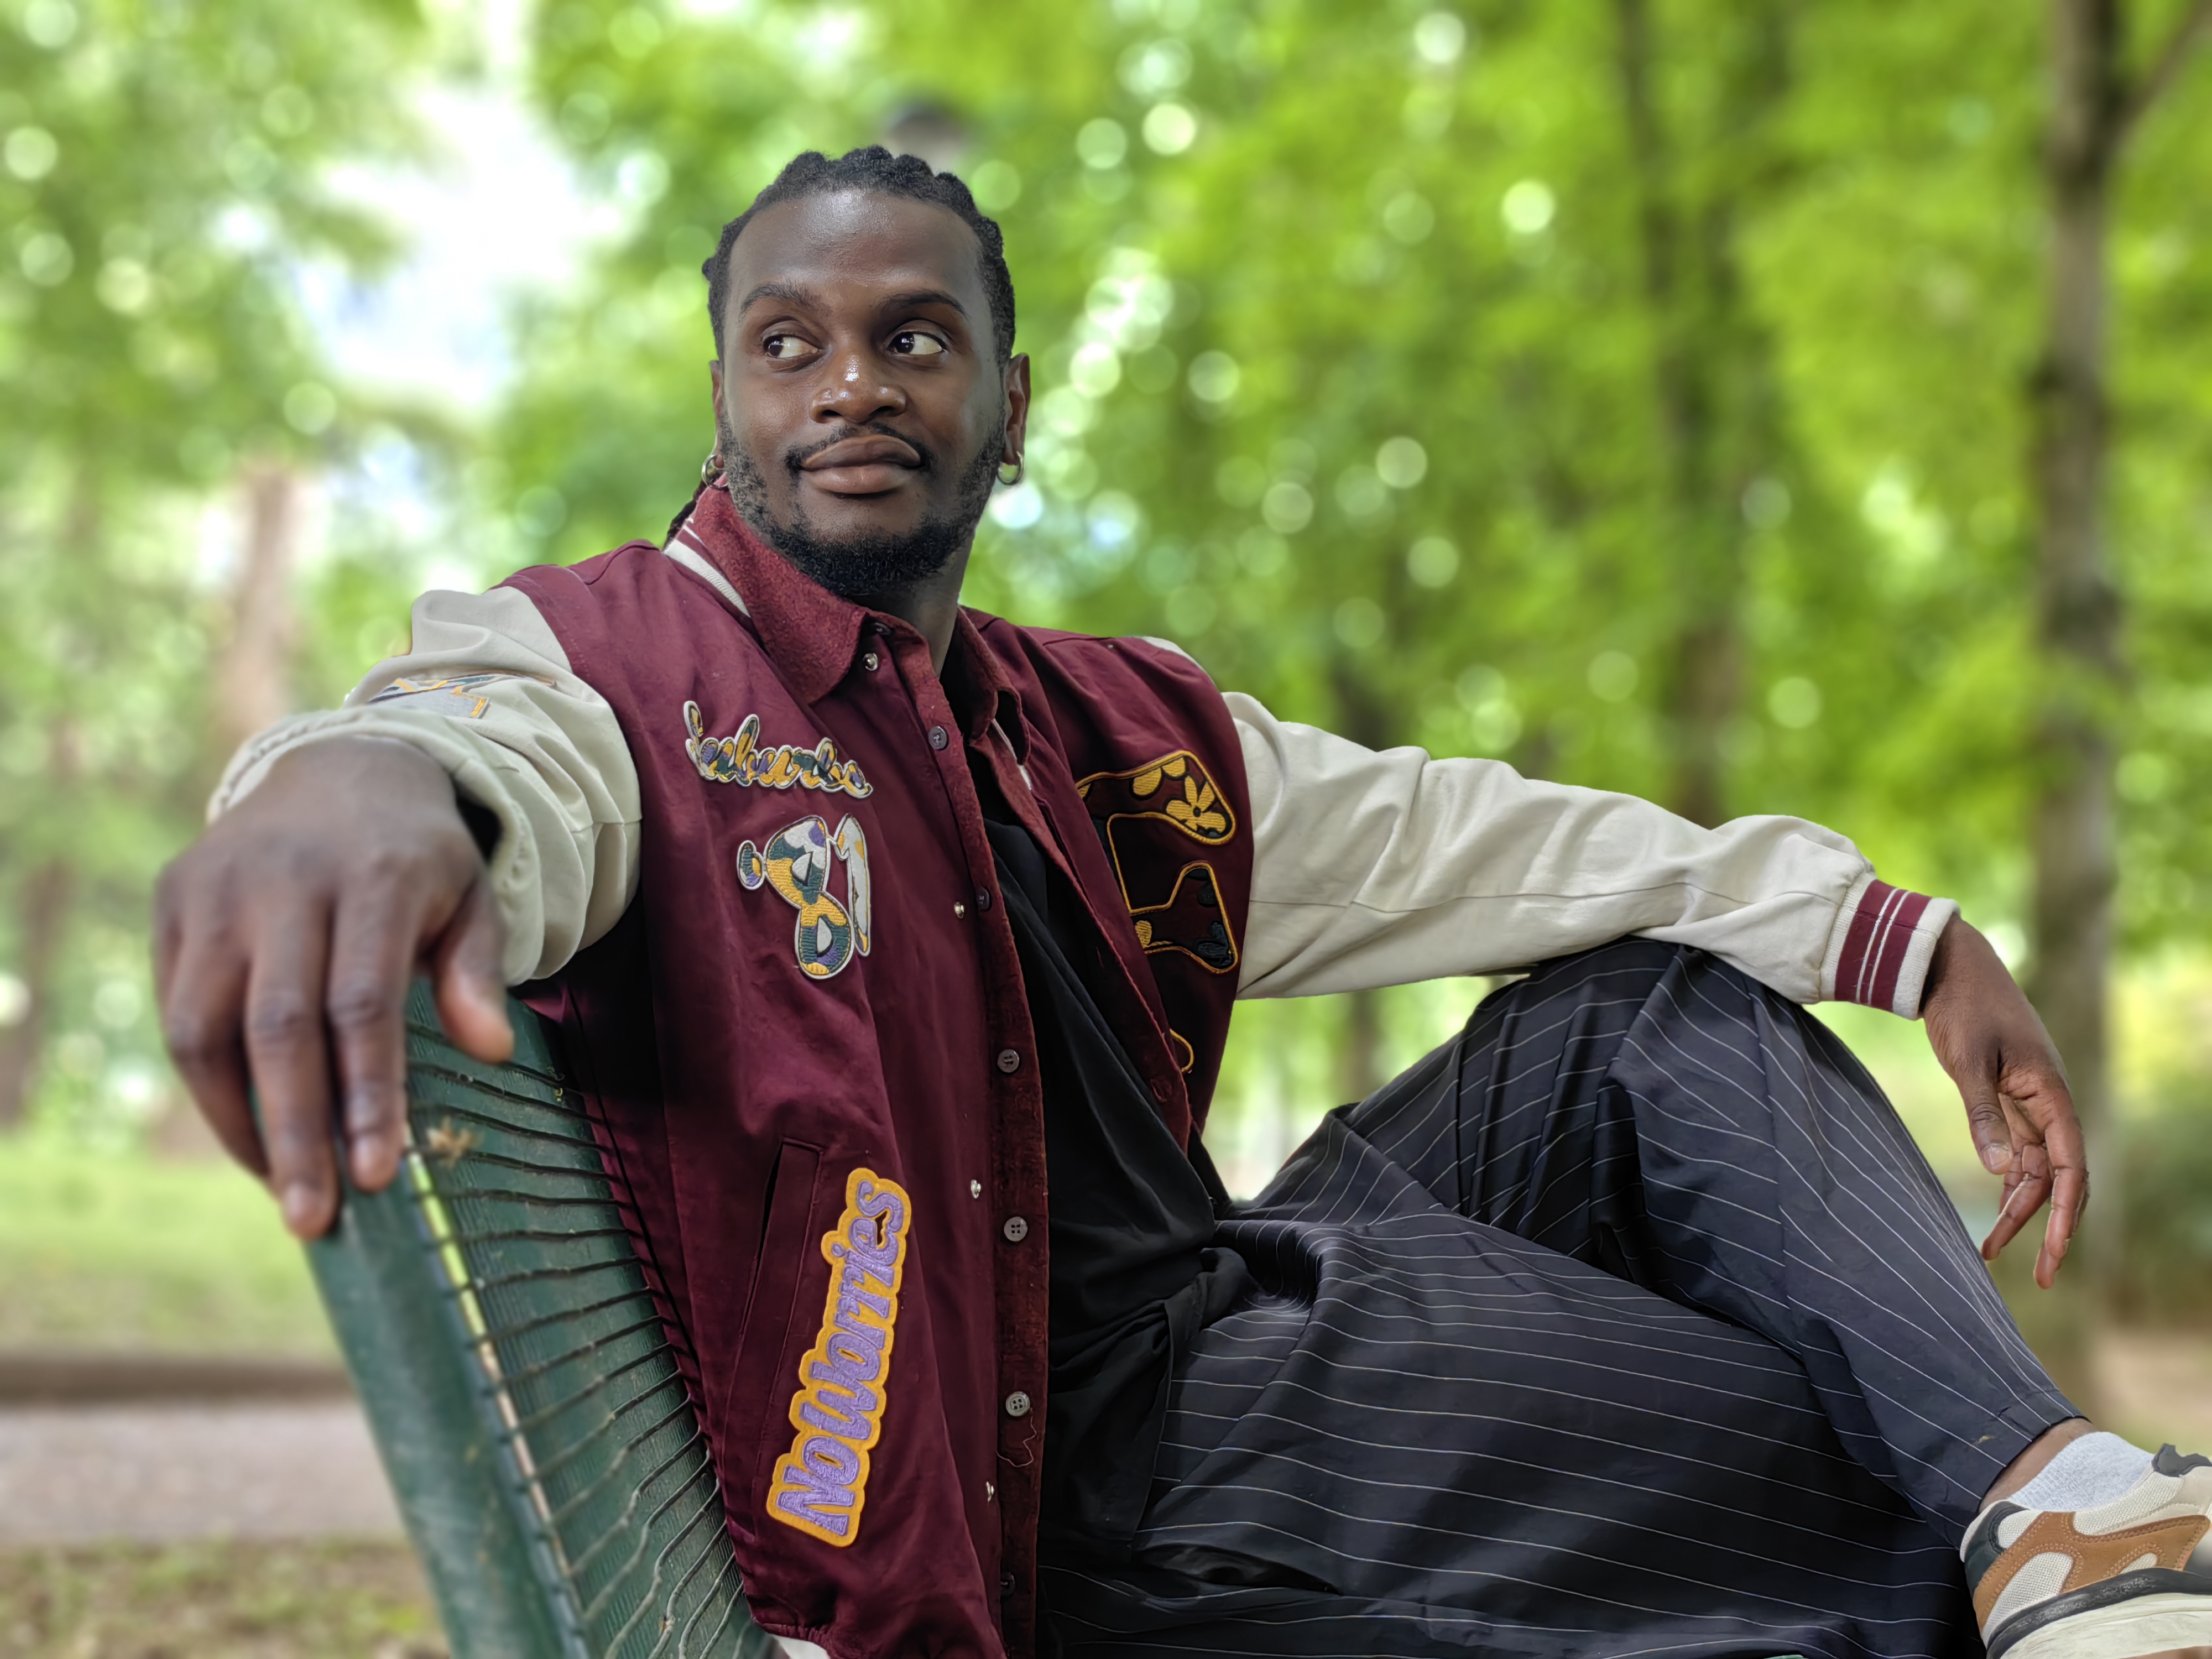
散景是在一个专门的模式下测试的,通常是人像或光圈模式,并针对在实验室和自然条件下拍摄的所有图像进行分析。目标是成像出的人像摄影,可与使用DLSR和大光圈拍摄的人像照片相媲美。主要图像质量属性是深度估计、伪像、模糊梯度和聚光灯形状模糊。人像图像质量属性(曝光、颜色、纹理)也被考虑在内。
在散景测试中,华为 P60 Pro 在个人照和团体照中都展现了出色的主体隔离与逼真的散景形状。细节水平相当高且大多数情况下图像的曝光度都很不错。除此之外,由于形状和色彩呈现准确的,即使是夜间拍摄,点光渲染也优于大多数竞争机种。总体而言,对于想要拍摄出像是 DSLR 照片的用户来说,这款手机是相当不错的选择。


预览
Huawei P60 Pro
93
在预览测试中,我们分析摄像头应用程序在预览图像时所呈现的图像质量,我们特别注意拍摄的图像和预览图像之间的差异,尤其是动态范围和散景效果。此外,我们还会评鉴从可用的最小变焦系数到最大变焦系数时的曝光、色彩,和对焦调整的平滑度。在预览帧率方面,我们使用 LED 通用计时器进行测量。
与华为 Mate 50 Pro 相比,华为 P60 Pro 的预览进步相当多,但还是比不上同类机种中的佼佼者-苹果 iPhone 14 Pro。我们的测试人员发现预览和所拍摄的图像间有些不同之处,尤其是预览中的散景所显现的深度估计与所拍摄的图像有明显的差异。好的部份是预览的目标曝光通常准确且和所拍摄的图像相去不远。我们也观察到在动态范围方面有些分歧,不过,整体预览与最终所拍摄的图像非常接近。
变焦
Huawei P60 Pro
169
DXOMARK 工程师在摄像头的默认设置下,使用捏拉缩放(即从超广角到极远距离的各种变焦倍数),在受控的实验室环境以及户外、室内和低光自然场景中拍摄超过 400 张测试图像,并予以评鉴。进行评鉴时,我们根据自然场景的参考标准对图像进行目视检查,并在实验室 20 到 1000 勒克斯和色温 2300K 到 6500K 的不同照明条件下对着图片进行拍摄,以对图像进行客观测量。
如同照片项目,华为 P60 Pro的摄像头在变焦项目的表现也是目前为止最为优异的。在远摄和广角的分数领先群雄,也让华为 P60 Pro 明显超越了之前在变焦项目拿下第一名的荣耀 Magic5 Pro。
如此出类拔萃的变焦效果是基于其强大的硬件和智能软件。远摄摄像头的f/2.1 快速光圈有助于收集大量光线,并通过结合远摄和主摄像头模块的图像信息,以融合算法来增加细节。大多数情况下,华为的曝光准确且色彩漂亮,而且在 0.5 倍到 10 倍左右的极大变焦范围中展现出非常优异的效果。最佳变焦倍数为3.5 倍(介于 80 毫米和 100 毫米之间),在此倍数之下,摄像头所呈现出的整体变焦图像质量会是最好的。此外,P60 Pro 的视频变焦比前款机种明显改进许多,大多数情况下的细节都更为丰富。
视频变焦
尽管较前一代机种有显着的改进,但视频变焦细节还是不及一些竞争对手,例如,OPPO Find X6 Pro 呈现出的精细细节更好,降噪功能也更为有效。

广角
Huawei P60 Pro
122
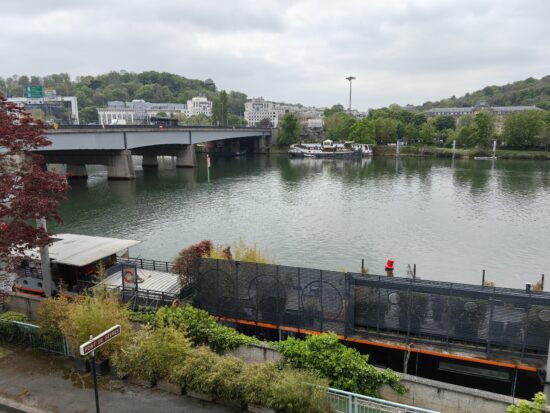
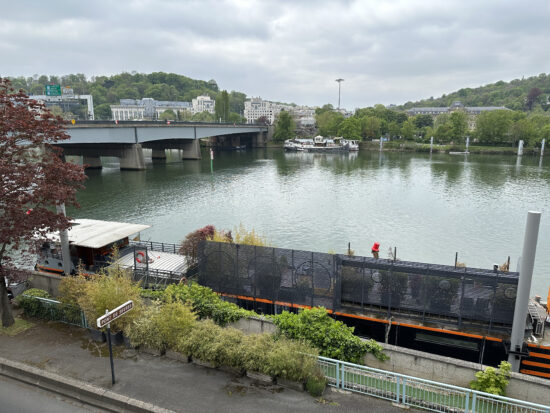
在这些测试中,我们分析超广角摄像头在 12 到 20 毫米的几个焦距上的表现。我们评鉴所有的图像质量属性,并特别注意色像差、镜头清晰度,和畸变等伪像。下面的照片摘录自测试场景。
凭借着等效13 毫米超广角视场,以及精细细节保留良好且13 毫米至 18 毫米的图像噪点控制得宜,华为 P60 Pro拿下了广角项目的最新高分。这款手机在低光下的表现也很出色,明显与大多数竞争对手有所差异;大多数竞争对手通常在这些具挑战性的条件下难以保持高质量和高水平的细节。

超广角摄像头的自动曝光、自动白平衡及自动对焦的平衡相当好。虽然视场广阔,但彩色边纹和边缘锐度降低这类的伪像很少,整体的清晰度非常不错。

远摄
Huawei P60 Pro
128
我们在大约 40 毫米至 300 毫米的焦距范围内对所有图像质量属性进行评鉴,并特别注意纹理和细节。此分数来自实验室中的许多客观测量和对现实生活图像的感知分析。
华为 P60 Pro 的远摄模块提供略低于 3.5 倍(90 毫米等效焦距)的远摄变焦系数。在我们的测试中,它呈现出高达10 倍变焦系数的品质图像。尽管主摄像头和远摄摄像头之间的焦距差异丢失了一些细节,不过,融合算法有助于保留住场景中主要主体的细节。相较于一些竞争对手(例如 OPPO Find X6 Pro),华为能够在所有光照条件下及各种对比度的场景中应用此技术。


与具有类似远摄焦距的其他机种相比,华为在远摄变焦设置下所捕捉到的细节水平明显更高。特别是在 7 倍左右,这款摄像头似乎是使用了一些软件解决方案以最大化远摄摄像头中 4800万像素传感器的分辨率潜力。


视频
Huawei P60 Pro
159
DXOMARK 工程师使用摄像头的默认设置,在受控的实验室环境和室内、户外自然场景中拍摄超过 2.5 小时的视频,并评鉴其拍摄结果。评鉴照片时,我们根据自然场景的参考标准对视频进行目视检查,并在实验室 1 到 1000+勒克斯和色温 2300 到 6500K 的不同照明条件下对着图片进行视频录制,以对视频图像进行客观测量。
P60 Pro 的视频模式是在4K 分辨率和每秒 30 帧、 HDR Vivid 格式下进行测试。整体视频性能非常好,处理得宜的曝光和色彩是华为在视频方面的主要新优势。与之前的机种相比,视频防抖功能有显着的改善,现在能与同类机种中表现最佳的苹果iPhone 14 Pro相提并论。请注意,以下的视频是以手机自身的 HDR 格式所拍摄,需要能够支持的设备才能播放。
[Missing IDs in shortcode]曝光
Huawei P60 Pro
116
在曝光测试中,我们评鉴主要拍摄对象的亮度和动态范围,例如摄像头在图像的高光位和阴暗地带呈现可见细节的能力,并分析曝光的稳定性和在随着时间推移而调节能力。
在视频曝光方面,P60 Pro 是我们见过表现最好的智能手机之一,呈现出良好的目标曝光和宽广的动态范围。此摄像头在保留高光和阴影细节方面都做得很好,使其成为拍摄高对比度场景的绝佳选择。
色彩
Huawei P60 Pro
120
在图像质量的色彩分析方面,我们着眼于演色性、肤色呈现、白平衡、彩色渐晕、白平衡的稳定性及其根据光线变化而调整的情况。
色彩是华为的另一个强项。在所有情况下,白平衡通常令人满意且稳定。有个小瑕疵是低光下的肤色呈现饱和度稍微不够。
自动对焦
Huawei P60 Pro
120
视频自动对焦略比同类机种中的佼佼者差一些,在室内稍微不稳,焦距变换期间有明显的步进痕迹。尽管有些许的不足之处,不过,自动对焦在大多数场景都能顺利运行,也让整体的视频体验感受良好。
纹理
Huawei P60 Pro
118
进行纹理测试时,我们分析在真实生活中,以及在实验室中针对图片录制的视频的细节和纹理水平。我们对自然视频进行视觉性的评鉴,并特别注意高光位和黑暗中的细节水平。我们在 1 到 1000 勒克斯之间的不同照明条件下对着图片进行拍摄,并对所拍摄的图像进行客观测量。拍摄时,我们使用 DXOMARK 图 (DMC) 和枯叶图。
华为 P60 Pro录制的视频细节水平很高,尤其是在明亮环境下。但是,在室内光线与低光下,细节明显减少。虽然摄像头在没有太多动作的静态场景中捕捉到丰富的细节,但在有更多移动元素的场景中丢失了精细细节。
噪点
Huawei P60 Pro
120
在噪点测试中,我们分析在现实生活中和在实验室图片上录制的视频图像噪点的各种属性,例如强度、色度、颗粒、结构,以及时域属性。我们对自然视频进行视觉性的评鉴,并特别注意黑暗区域和高动态范围条件下的噪点。我们在 1 到 1000 勒克斯之间的不同照明条件下对着图片进行录制,并对所录制的视频进行客观测量。我们使用 DXOMARK 视觉噪点图表。
虽然P60 Pro 录制的视频片段有时会出现一些局部噪点,不过,整体的噪点还是控制的不错。

防抖
Huawei P60 Pro
119
评鉴防抖性能时,我们测试手机通过 OIS、EIS 或任何其他软件或硬件技术来稳定影像的能力。我们的评鉴着眼于各种照明条件下,边走边拍和边跑边拍的用例中的运动残影、流畅度、抖动伪像和运动残影模糊。下面的视频摘录自一个测试场景。
从P60 Pro机种中可看出华为在视频防抖方面明显迈了一大步。Mate 50 Pro 的清晰度不一致,影响了整体的视频质量,而P60 Pro 的表现与同类机种的翘楚-苹果iPhone 14 Pro旗鼓相当。
伪像
Huawei P60 Pro
86
评鉴伪像时,我们使用 MTF,并测量实验室中的 SFR 图表上的振铃,我们也使用 LED 通用计时器进行帧率测量。对自然视频进行视觉评鉴时,我们特别注意混叠、量化、块状和色相偏移等伪像。伪像越严重,越频繁,所扣分数就越多。下面列出主要的伪像和相应的扣分。
我们的测试人员在华为录制的视频片段中只看到极少数不必要的伪像,包括混迭(即使在高端设备中也很常见)、量化(有时在彩色区块上看得到),以及振铃和闪烁(主要在室内条件下能观察到)。