该手机结合了三个具有超分辨率和融合算法的摄像头模块,因此变焦质量是该手机的一大强项,从超广角到远距变焦都可以保留很好的细节。总体而言,Mate 50 Pro 在变焦方面排名第二,仅次于荣耀 Magic4 Ultimate,后者在中远距的细节上略胜一筹。
在视频方面,我们在 4K 分辨率下使用每秒 30 帧的速度对 Mate 50 Pro 进行了测试,并启用了 Vivid HDR 模式。Vivid HDR 是一种已有记录的新 HDR 视频格式,并已获得手机和某些电视的支持 (http://www.theuwa.com/terminal-certify)。总体而言,Mate 50 Pro 的视频表现不如静态图像出色,仅排名第 7,低于其竞品谷歌 Pixel 7 Pro 和最新的苹果 iPhone。曝光是视频的主要优势,在高光下和室内都可以拍出准确的测标曝光度和宽广的动态范围。然而,华为 Mate 50 Pro 在纹理/噪点折衷方面有些落后于同类产品中的佼佼者,尤其是在低光下。
BEST 154
Top score Huawei Pura 70 Ultra
人像
在我们新的人像用例评分中,Mate 50 Pro 的得分比谷歌 Pixel 7 Pro 高 1 分,比苹果 iPhone 14 Pro 高 2 分。如上所述,该华为手机凭借新的可变光圈在集体合影竞争中获得了真正的优势;它的肤色演色性大致很好,但在特定条件下可能会偏粉红色或橙色。我们的测试人员还发现 Mate 50 Pro 在拍摄决定性时刻方面表现得比一些竞品要逊色些,尤其是在低光条件下,Pixel 7 Pro 拍摄图像的速度更快,并且更能避免运动模糊。
值得一提的是,Mate 50 Pro 没有配备 P50 Pro 上的徕卡成像系统,而是配备了华为自己的超光变XMAGE影像系统,让用户可以在三种呈现图像的预设中进行选择:Vivid(鲜艳)、Bright(明快)、Original(原色)。Vivid 可增加对比度,Bright 可增加亮度,同时平衡曝光,Original 则可以尝试呈现用户眼睛看到的色彩。我们的所有测试都是在默认 Original 原色下完成的。
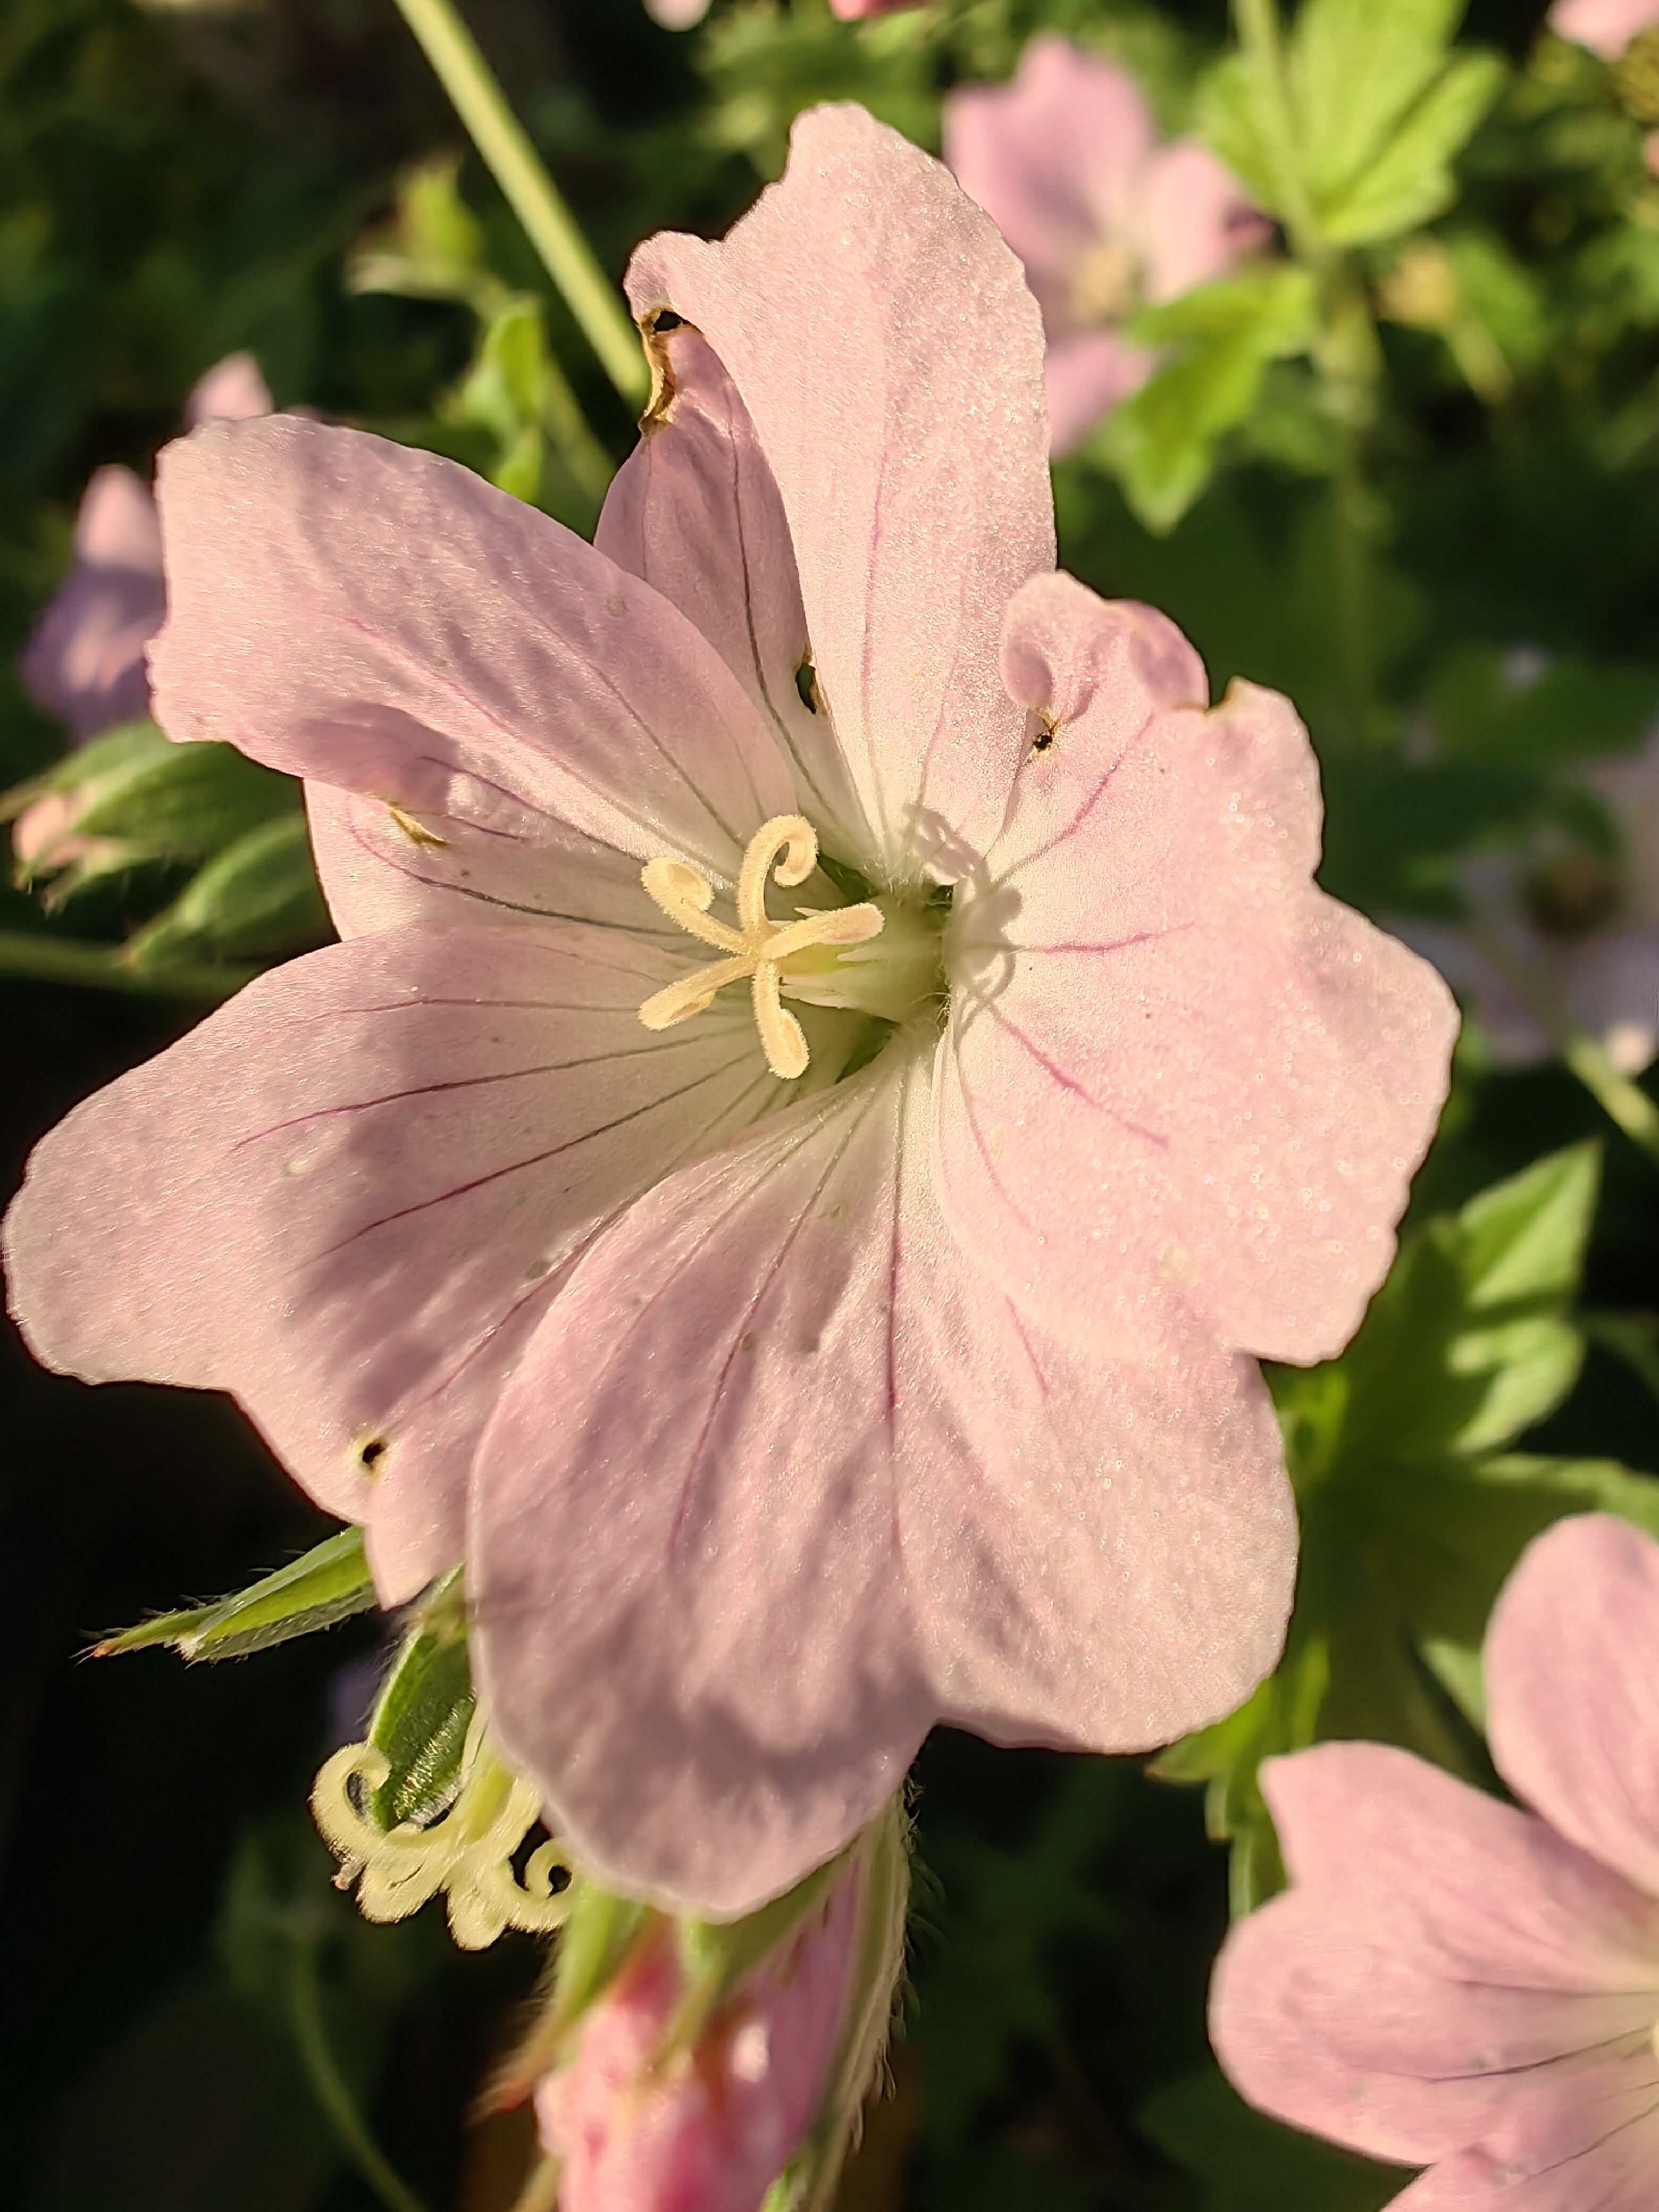
华为 Mate 50 Pro – 宜人的自然色彩;宽广的景深使所有被摄体都清晰对焦
BEST 138
Top score Huawei Pura 70 Ultra
低光拍摄
在昏暗条件下进行测试时,Mate 50 Pro 可拍出清晰且非常自然的细节,以及非常宽广的动态范围。总体而言,该手机取得了我们迄今所见的最佳低光得分。图像呈现非常均衡,色彩漂亮而鲜艳,对比度宜人。华为工程师似乎试图通过偏暖的色偏来呈现低光场景的气氛。在低光条件下,该摄像头将光圈保持在 f/1.4 完全打开的状态,以便摄入尽可能多的光线。
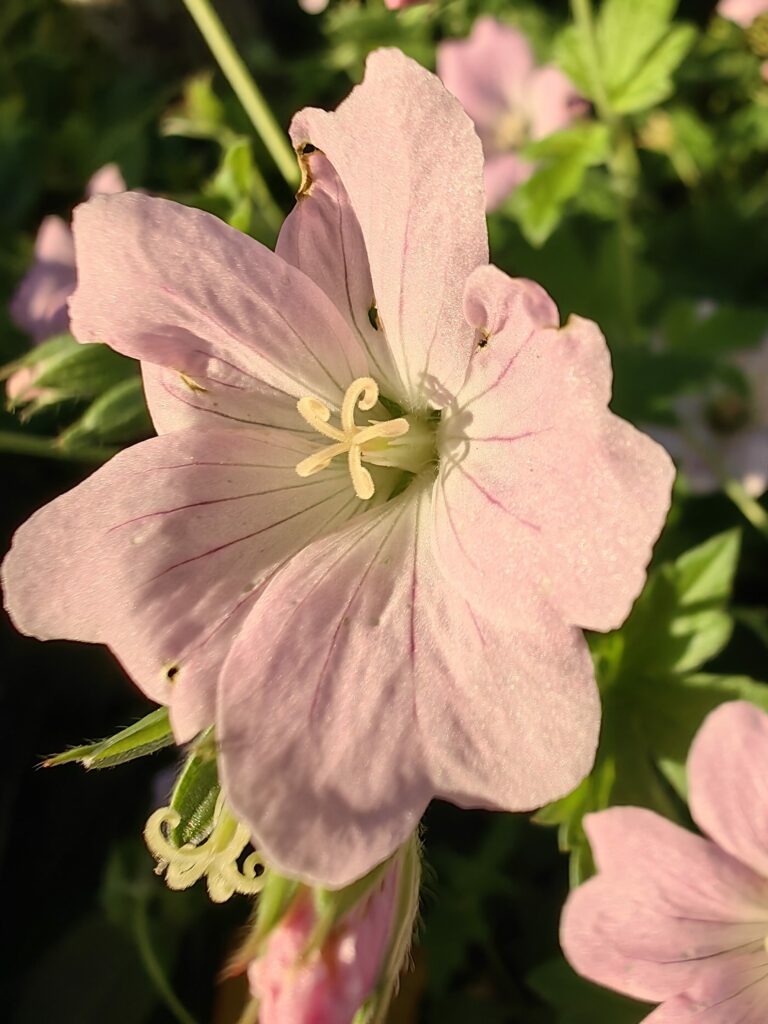
华为 Mate 50 Pro - 悦目的对比度,白平衡接近保真度
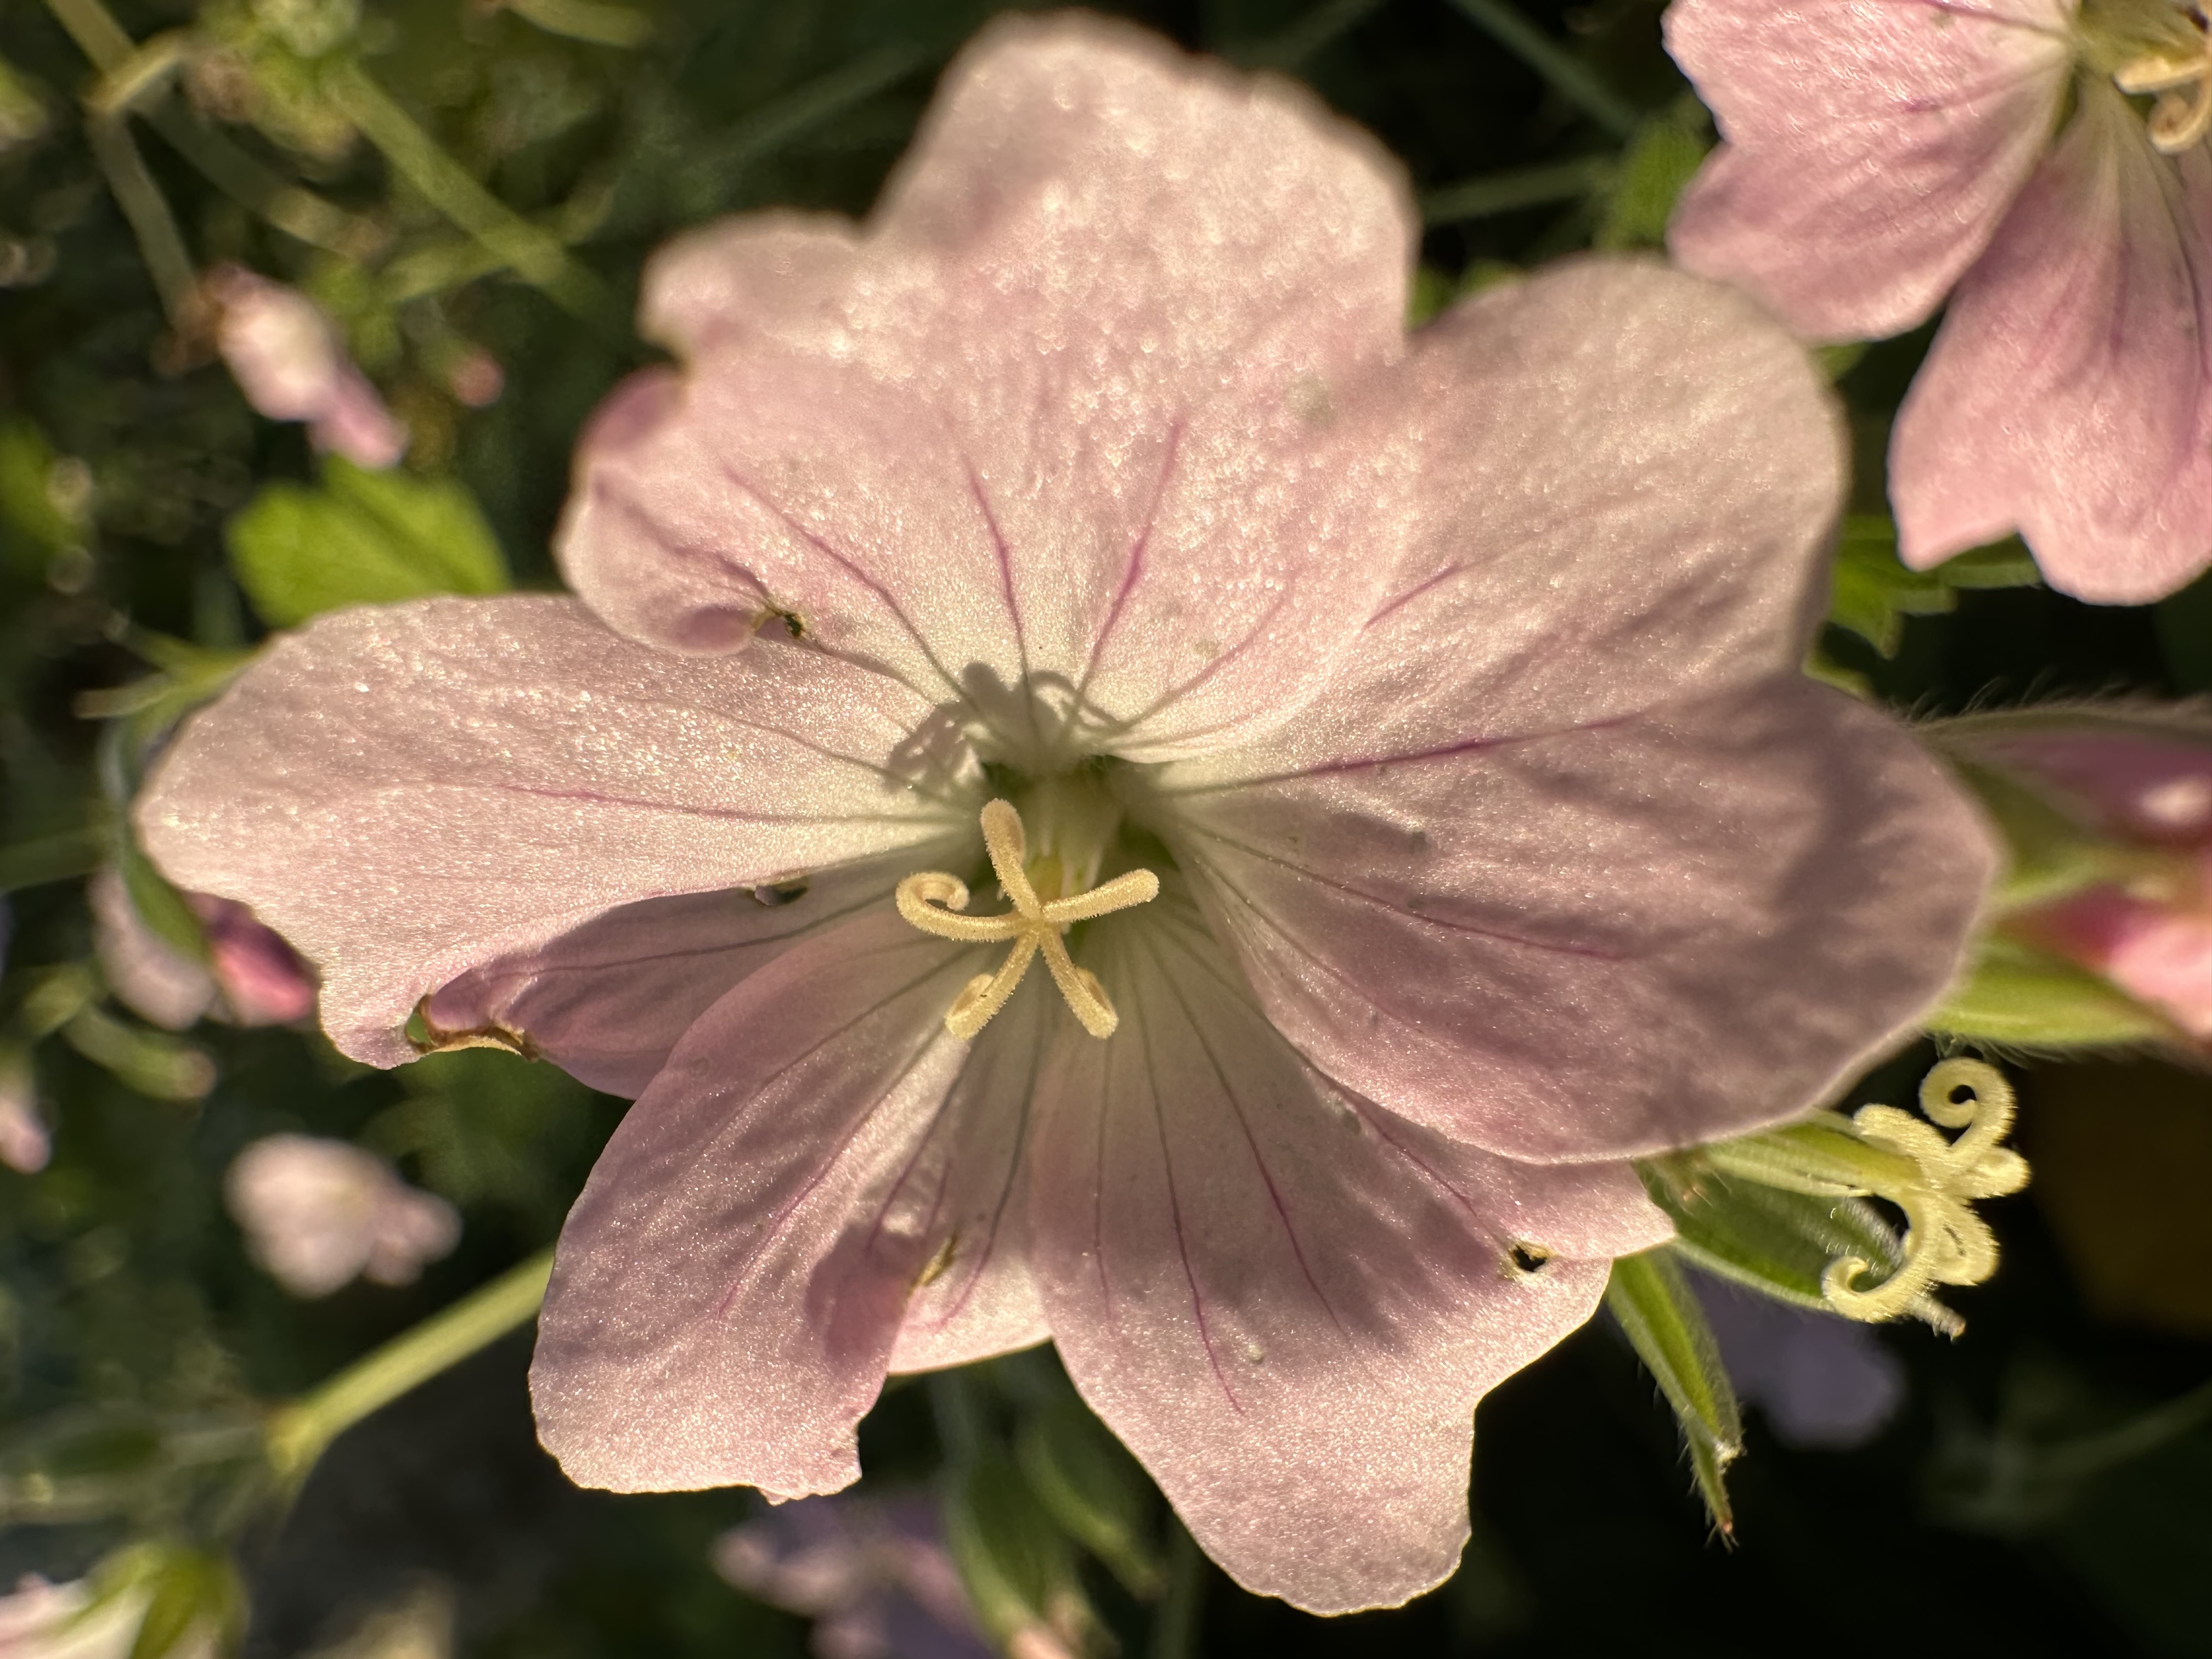
华为 Mate 50 Pro 细节呈现很自然
谷歌 Pixel 7 Pro- 白平衡偏蓝
谷歌 Pixel 7 Pro - 自动对焦严重失败
苹果 iPhone 14 Pro - 白平衡略带黄绿色
苹果 iPhone 14 Pro - 细节过度锐化
在低光下使用远摄变焦时,Mate 50 Pro 在大多数变焦设置下也成功保留了更多细节,噪点水平也低于竞品。
DXOMARK CHART (DMC) detail preservation score per focal length
This graph shows the evolution of the DMC detail preservation score with respect to the full-frame equivalent focal length for different light conditions. The x-axis represents the equivalent focal length measured for each corresponding shooting distance and the y-axis represents the maximum details preservation metric score: higher value means better quality. Large dots correspond to zoom ratio available in the user interface of the camera application.
另一方面,该手机的低光视频质量低于其竞品,与 iPhone 14 Pro 相比尤其如此。在昏暗条件下录制视频时,该手机最明显的缺点是纹理伪像和相对比较严重的噪点。
测试摘要
关于DXOMARK摄像头测试:在 DXOMARK 进行 Camera 评鉴时,我们在实验室和现实生活情境中拍摄各种各样的主题,然后根据客观测试和感知测试来进行评分。进行客观测试时,我们使用实验室环境中的测量软件直接计算测试结果;感知测试则是由一群图像专家根据一套复杂的度量标准,就需要人为判断的图像质量进行各个方面的比较。智能手机测试需要一个由工程师和技术员组成的团队进行大约一周的测试。他们分别对照片、变焦和视频质量进行评分,然后将这些分数合并为总分,以便在不同手机的摄像头之间进行比较。关于DXOMARK摄像头基准的更多信息,请点击这里。关于智能手机摄像头得分的更多细节,请点击这里。以下部分集合了我们在DXOMARK实验室进行的详尽测试和分析的主要内容。根据需求,我们可以提供更详细的性能评估报告。您可以 与我们联系。
Autofocus irregularity and speed: 20Lux Δ0EV Tungsten Handheld
This graph illustrates focus accuracy and speed and also zero shutter lag capability by showing the edge acutance versus the shooting time measured on the AFHDR setup on a series of pictures. All pictures were taken at 20Lux with Tungsten illuminant, 500ms after the defocus. The edge acutance is measured on the four edges of the Dead Leaves chart, and the shooting time is measured on the LED Universal Timer.
Autofocus irregularity and speed: 1000Lux Δ0EV Daylight Handheld
This graph illustrates focus accuracy and speed and also zero shutter lag capability by showing the edge acutance versus the shooting time measured on the AFHDR setup on a series of pictures. All pictures were taken at 1000Lux with Daylight illuminant, 500ms after the defocus. The edge acutance is measured on the four edges of the Dead Leaves chart, and the shooting time is measured on the LED Universal Timer.
DXOMARK CHART (DMC) detail preservation score vs lux levels for tripod and handheld conditions
This graph shows the evolution of the DMC detail preservation score with the level of lux, for two holding conditions. DMC detail preservation score is derived from an AI-based metric trained to evaluate texture and details rendering on a selection of crops of our DXOMARK chart.
在噪点测试中,我们分析在现实生活中和在实验室图片上拍摄的图像噪点的各种属性,例如强度、色度、颗粒和结构。就自然图像而言,我们特别注意面部、风景以及阴暗区域和高动态范围条件下的噪点。我们也会评鉴自然图像中的运动物体上的噪点。我们在 1 到 1000 勒克斯之间的各种照明条件以及不同类型的动态范围条件下对着图片进行拍摄,并对所拍摄的图像进行客观测量。我们使用枯叶图并进行标准化的测量,例如源自 ISO 15739 的视觉噪点。
在这张图表中,我们可以看到在实验室的不同光照水平下,Mate 50 Pro 和两个竞品的视觉噪点的测量结果。Mate 50 Pro 在所有光照水平下通常都可以将噪点控制得很好。
Visual noise evolution with illuminance levels in handheld condition
This graph shows the evolution of visual noise metric with the level of lux in handheld condition. The visual noise metric is the mean of visual noise measurement on all patches of the Dead Leaves chart in the AFHDR setup. DXOMARK visual noise measurement is derived from ISO15739 standard.
华为的降噪策略与之前的机型保持不变,在任何条件下几乎都没有明显的亮度噪点。这与 Pixel 7 Pro,尤其是 iPhone 14 Pro 完全不同,这两款手机的图像都存在一些细微的噪点。华为 Mate 50 Pro 的整体噪点得到了很好的控制,只有一些色度噪点“斑纹”会很明显,导致图像区域呈粉红色,尤其是在低光下。
DXOMARK CHART (DMC) detail preservation score per focal length
This graph shows the evolution of the DMC detail preservation score with respect to the full-frame equivalent focal length for different light conditions. The x-axis represents the equivalent focal length measured for each corresponding shooting distance and the y-axis represents the maximum details preservation metric score: higher value means better quality. Large dots correspond to zoom ratio available in the user interface of the camera application.
进行近距远摄变焦(40 毫米到 70 毫米)时,Mate 50 Pro 在画面中心拍出自然的图像,令人印象深刻,精细细节良好,动态范围宽广,色彩也很漂亮,但是融合算法可能会使图像角落损失一些锐度。
DXOMARK CHART (DMC) detail preservation video score vs lux levels
This graph shows the evolution of the DMC detail preservation video score with the level of lux in video. DMC detail preservation score is derived from an AI-based metric trained to evaluate texture and details rendering on a selection of crops of our DXOMARK chart.
在大多数情况下,Mate 50 Pro 视频影片的细节通常非常丰富。然而,一些纹理伪像可能会非常明显,在低光下尤其如此,从而对视频纹理表现产生了重大影响。
Spatial visual noise evolution with the illuminance level
This graph shows the evolution of spatial visual noise with the level of lux. Spatial visual noise is measured on the visual noise chart in the video noise setup. DXOMARK visual noise measurement is derived from ISO15739 standard.
Temporal visual noise evolution with the illuminance level
This graph shows the evolution of temporal visual noise with the level of lux. Temporal visual noise is measured on the visual noise chart in the video noise setup.