我们把联想 ThinkPad T14 Gen4放在DXOMARK严格的笔记本电脑测试基准中,测试其音频,摄像头和屏幕三方面的性能。
在这篇测评中,我们将分析它在不同测试和几个常见的使用场景中的表现。
概述
评分
Use-case and feature subscores included in the calculations of the global score
 Lenovo ThinkPad T14 Gen 4

124
laptop
90
Apple MacBook Pro 14" (M3 Pro, 2023)
Best: Apple MacBook Pro 14" (M3 Pro, 2023) (135)
139
LG gram Style (14Z90RS)
Best: LG gram Style (14Z90RS) (142)
122
Apple MacBook Pro 14" (M2 Pro, 2023)
Best: Apple MacBook Pro 14" (M2 Pro, 2023) (144)
140
Apple MacBook Pro 14" (M3 Pro, 2023)
Best: Apple MacBook Pro 14" (M3 Pro, 2023) (156)
109
Apple MacBook Pro 14" (M2 Pro, 2023)
Best: Apple MacBook Pro 14" (M2 Pro, 2023) (152)
优点
- 摄像头的目标曝光通常准确
- 视频通话期间屏幕反射率处理得宜,不会受到干扰
- 音频收录与语音都很清晰,呈现出悦耳的声音
- 在音乐与视频中,屏幕展现出良好的亮度范围,HDR 内容的最大亮度高于其所宣称的亮度(600 尼特 vs 其宣称的 500 尼特)
- SDR 和 HDR 的色彩呈现都很不错
不足
- 在视频通话中,高动态场景中有时会出现严重的曝光不稳定,且动态范围有限
- 双工情况下处理音频的能力有限
- 在音乐与视频中,HDR的 EOTF会出现与其他 Windows 笔记本电脑上类似的高光剪贴,且黑阶会受到面板的技术而有所限制
- 音乐与视频中的声音不悦耳
T14 展现出良好且一致的屏幕性能,让SDR 和 HDR 内容都能具有良好的易读性及保真度。其内置麦克风的性能令人相当满意,能传递出悦耳的音色及良好的清晰度(不过在处理双工通话的部份并不是最优秀的)。不足之处是由于其内置扬声器的音色较差,播放性能的表现较不理想。这款笔记本电脑的摄像头性能表现一般,但在棘手的照明条件下可能会有所限制。
测试摘要
关于DXOMARK笔记本电脑测试:为了提供详尽的产品分析和评分,DXOMARK的工程师团队在受控的实验室条件和真实场景下进行全面的客观测试,以及超过20小时的感观评估。
((获取更多关于笔记本电脑测试基准的详情,请点此处), click here.)
以下内容汇集了我们在DXOMARK专业实验室所进行的详尽测试和分析的成果要点。详细的性能评估报告可根据要求提供。请与我们联系。 contact us.
Lenovo ThinkPad T14 Gen4 overall & use-cases scores
视频会议
123
Lenovo ThinkPad T14 Gen 4
144
Apple MacBook Pro 14" (M2 Pro, 2023)
Apple MacBook Pro 14" (M2 Pro, 2023)
关于DXOMARK笔记本电脑测试
DXOMARK的视频通话用例得分评估了设备在多种使用场景下处理视频通话和视频会议的能力。该得分主要关注摄像头的性能以及语音撷取和播放渲染效果。欲了解更多有关我们如何测试视频通话得分的用例,请点击此处。.
在视频通话期间,摄像头的目标曝光一般来说是准确的,但在高动态场景中有时会出现严重的曝光不稳定。动态范围有限,色彩呈现有时会不准确。内置麦克风呈现出悦耳的声音及出色的语音清晰度,但两个人同时说话时,可能会听不到对方的声音。
Camera
90
Lenovo ThinkPad T14 Gen 4
135
Apple MacBook Pro 14" (M3 Pro, 2023)
Apple MacBook Pro 14" (M3 Pro, 2023)
Camera texture acutance on Deadleaves with illuminance levels
This graph shows the evolution of texture acutance with the level of lux measured on a Deadleaves chart.
以下图表展示了在图像质量实验室进行客观测量的结果:
Camera visual noise evolution with illuminance levels
This graph shows the evolution of spatial visual noise with the level of lux. Spatial visual noise is measured on the visual noise chart in the video noise setup. DXOMARK visual noise measurement is derived from ISO15739 standard.
Target exposure on face with illuminance levels
These measurements take place on a setup combining realistic mannequins and a backlit panel simulating high dynamic range conditions. This graph shows the evolution of lightness measured on the forehead of the realistic mannequin with the level of lux, for multiple lighting conditions. The lightness is measured in L*. Delta EV specifies the difference of luminance in stops between the face and the light panel simulating HDR conditions.
Target exposure on face with illuminance levels in HDR conditions
These measurements take place on a setup combining realistic mannequins and a backlit panel simulating high dynamic range conditions. This graph shows the evolution of lightness measured on the forehead of the realistic mannequin with the level of lux, for multiple lighting conditions. The lightness is measured in L*. Delta EV specifies the difference of luminance in stops between the face and the light panel simulating HDR conditions.
音频
122
Lenovo ThinkPad T14 Gen 4
144
Apple MacBook Pro 14" (M2 Pro, 2023)
Apple MacBook Pro 14" (M2 Pro, 2023)
Audio capture scores comparison
以下图表展示了在我们的半消声室中录制的音频撷取的频响、失真和指向性:
Audio capture frequency response
A 1/12 octave frequency response graph, which measures the volume of each frequency captured by the laptop when recording an objective test signal at 1 meter in an anechoic environment.
Audio capture Total Harmonic Distortion + Noise
This graph shows the Total Harmonic Distortion and Noise over the hearable frequency range. It represents the distortion and noise of the device capturing our test signal.
Audio capture directivity
Directivity graph of the laptop microphone(s) when capturing test signals using the camera app. It represents the acoustic energy (in dB) over the angle of incidence of the sound source (normalized to the angle 0°, in front of the device).
关于DXOMARK的笔记本电脑测评
DXOMARK的视频和音乐用例评分旨在评估设备在室内条件下播放多媒体内容(如视频、电影和音乐)的能力。该得分主要侧重屏幕性能和音频播放效果。欲了解更多关于我们如何测试这一用例的信息,请点击此处。
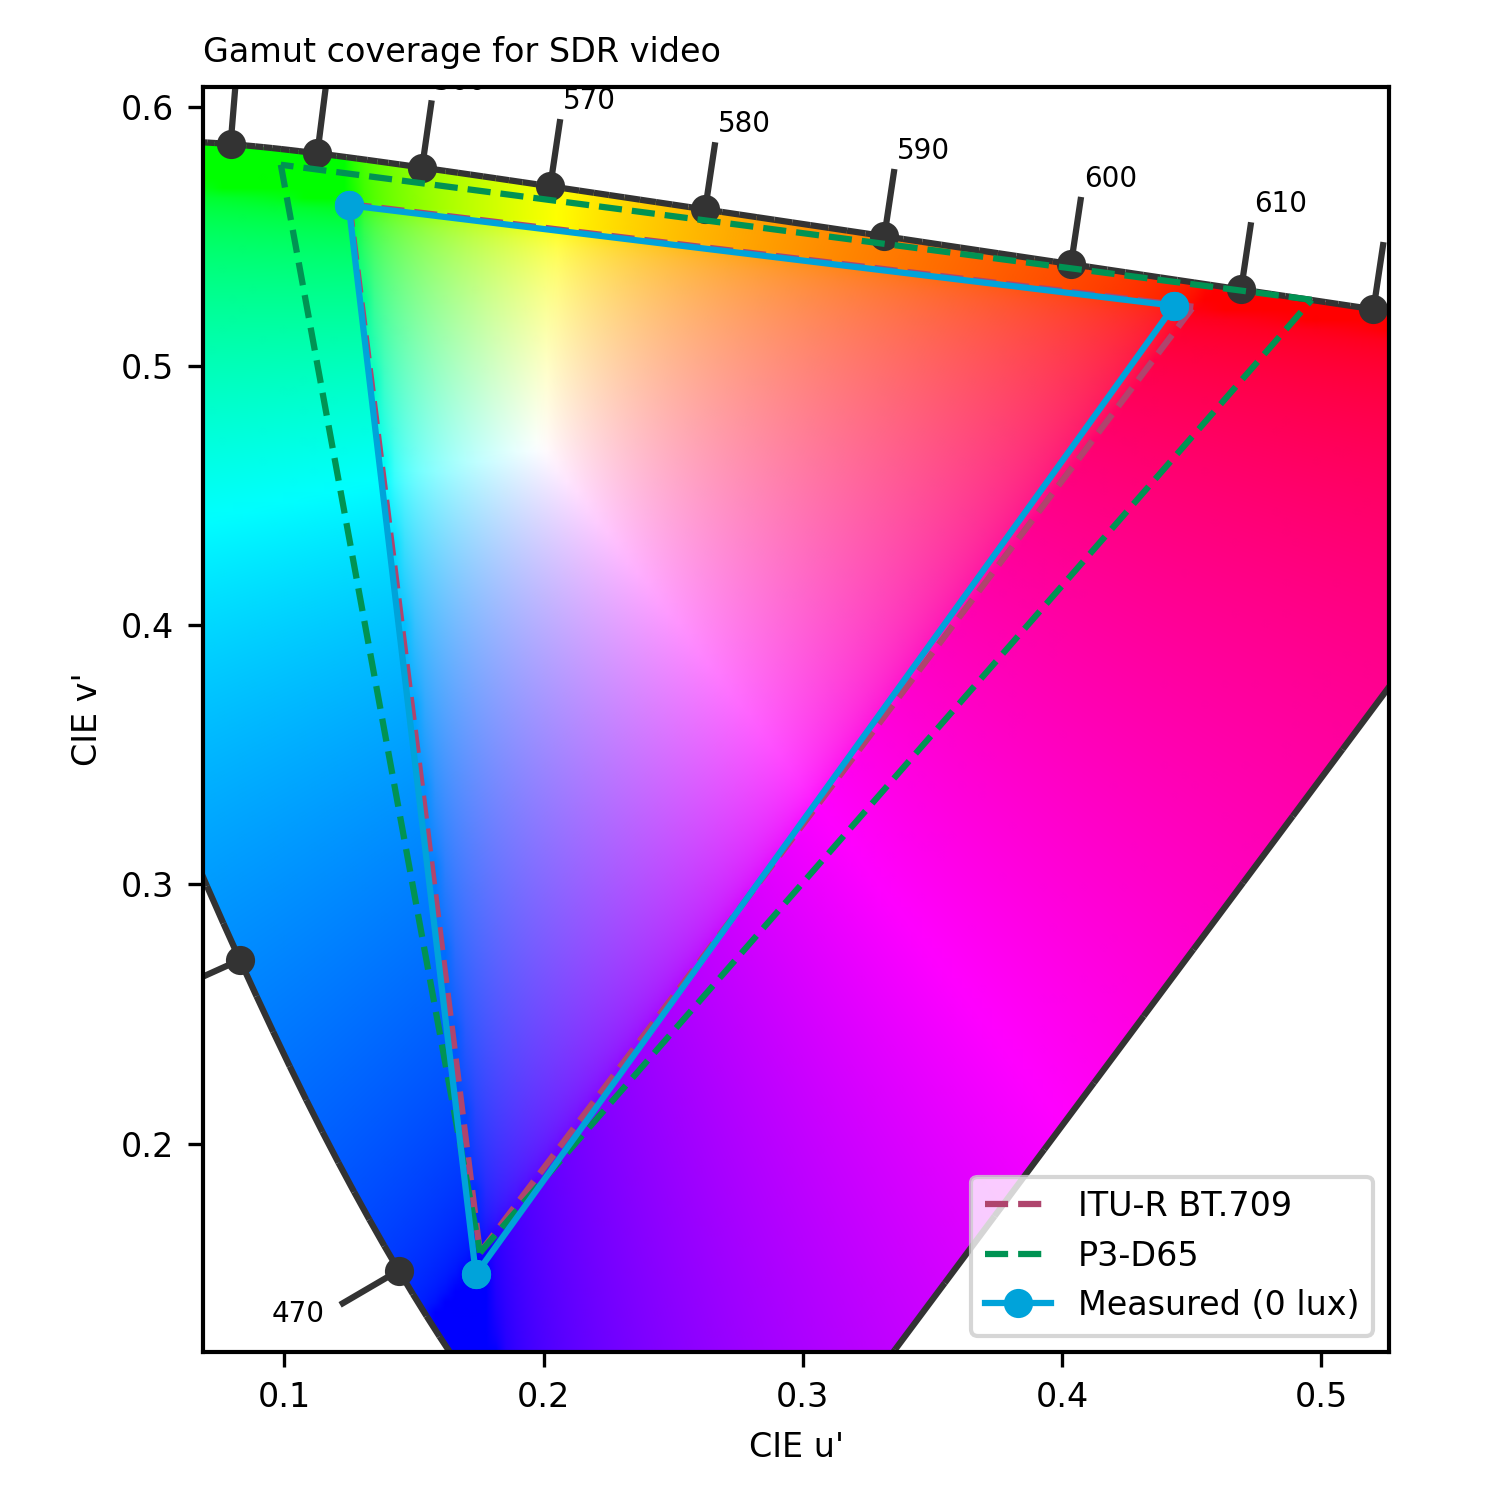
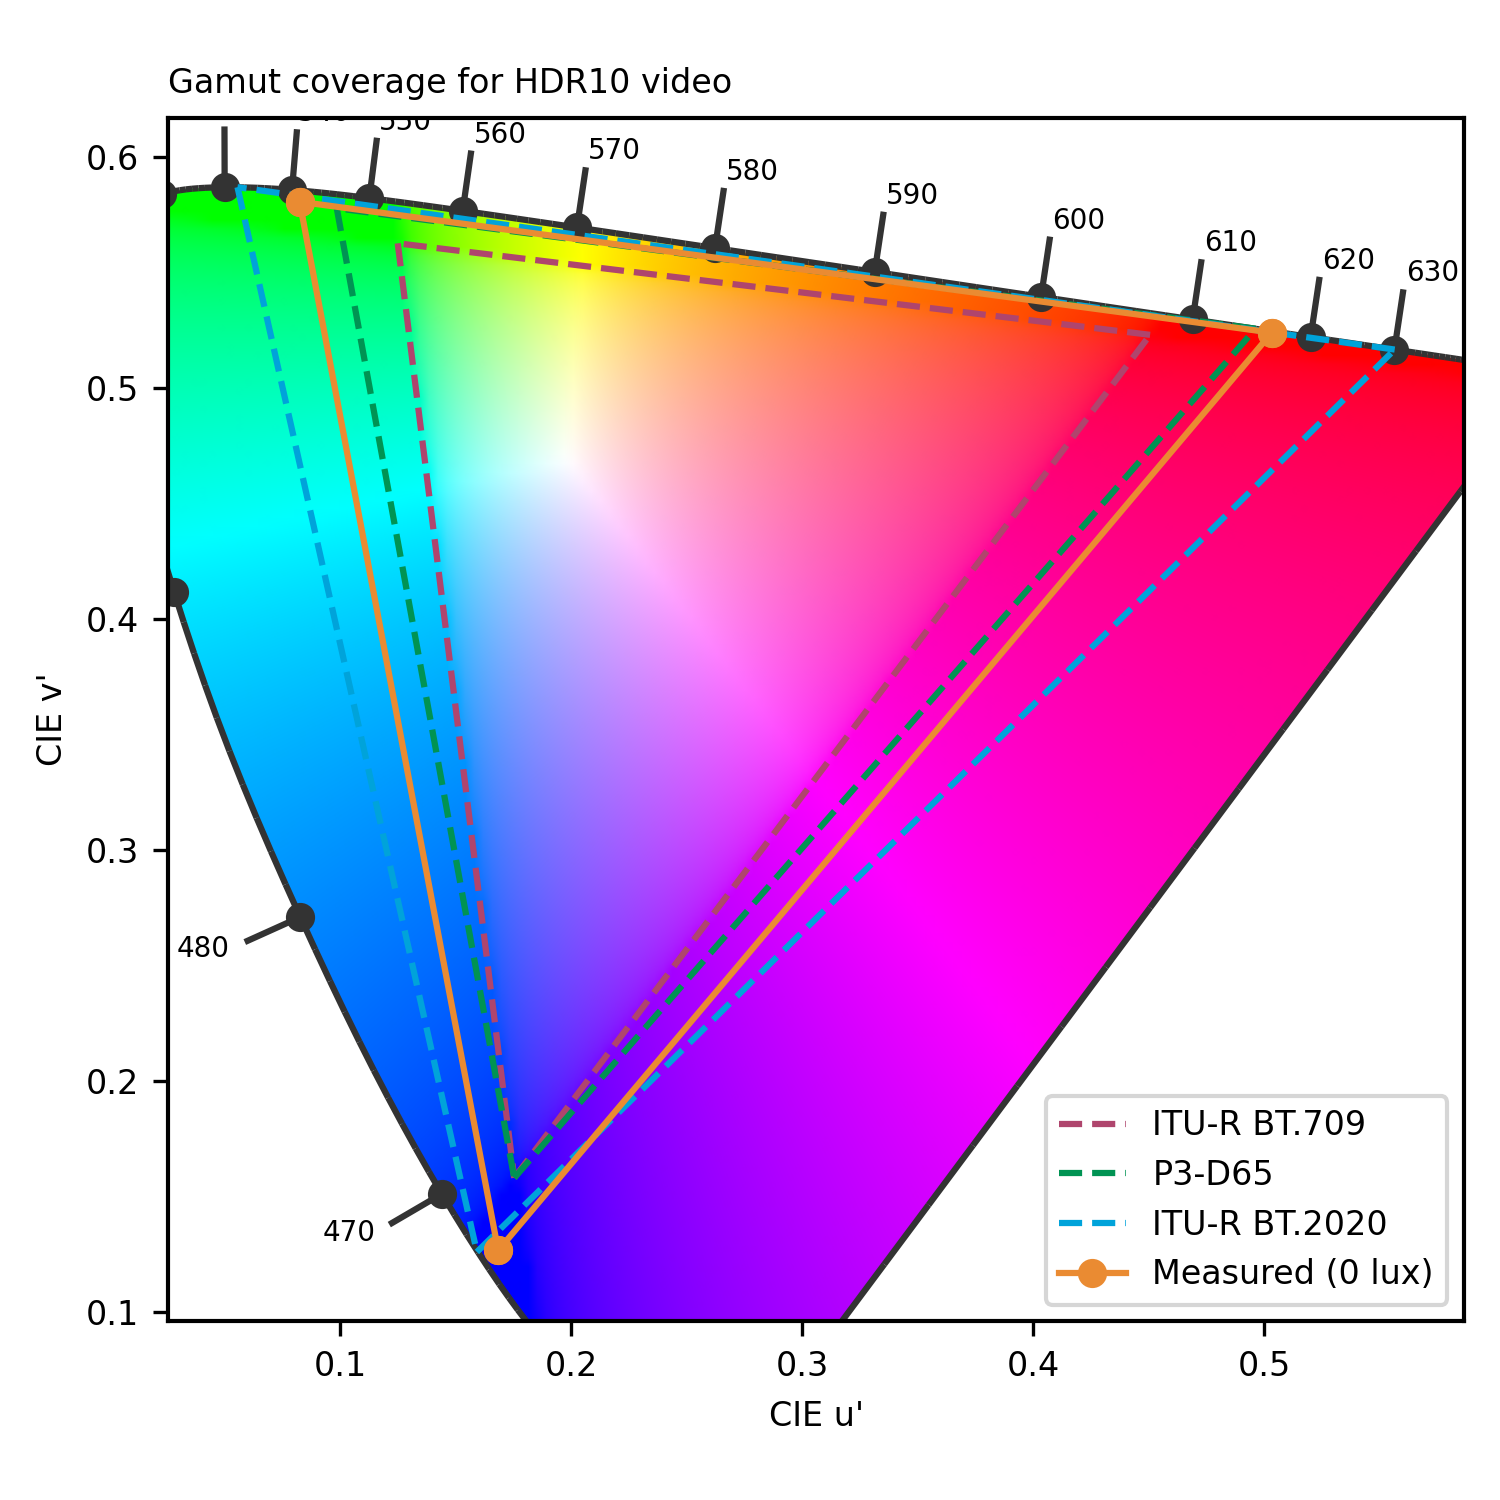
T14 Gen 的屏幕具有高于平均水平的亮度范围(600 尼特vs其所宣称的 500 尼特),并展现出宽广的 HDR 色域。 在 SDR 中的色彩呈现良好,虽然蓝色的饱和度稍显不足。反射的情况处理的不错。黑色的暗度(尤其是 SDR 内容)受到面板技术的限制;与我们测试过的其他 Windows 笔记本电脑一样,在HDR 内容中呈现高亮度的画面时会出现令人困扰的高光剪贴。内置扬声器的频率范围有限且声音不怎么悦耳。
以下图表展示了多媒体用例的屏幕子分数:
Display scores comparison
以下图表是我们屏幕实验室客观测量的结果:
Display gamut coverage for video contents
The primary colors are measured both in HDR10 and SDR. The extracted color gamut shows the extent of the color area that the device can render. To respect the artistic intent, the measured gamut should match the master color space of each video.
Display reflectance measurement (SCI)
Measurements above show the reflection of the device within the visible spectrum range (400 nm to 700 nm). It includes both diffuse and specular reflection.
Display reflectance profile
Display brightness uniformity
0.15
cd/m²
0.108
cd/m²
0.117
cd/m²
0.176
cd/m²
0.13
cd/m²
0.139
cd/m²
0.201
cd/m²
0.157
cd/m²
0.17
cd/m²
 Distribution of brightness (min)
423.9
cd/m²
423.7
cd/m²
426.6
cd/m²
408.1
cd/m²
411
cd/m²
416.7
cd/m²
405.4
cd/m²
407.3
cd/m²
414.4
cd/m²
Distribution of brightness (max)
This illustration shows the brightness measured on nine zones of the display for minimum brightness (left) and maximum brightness (right) for SDR content.
Display SDR EOTF measurement
This graph represents the rendering of contrast (gray levels) for SDR video content, measured in the dark. We expect to be close to the 2.2 or 2.4 gamma references.
Display peak brightness for video contents
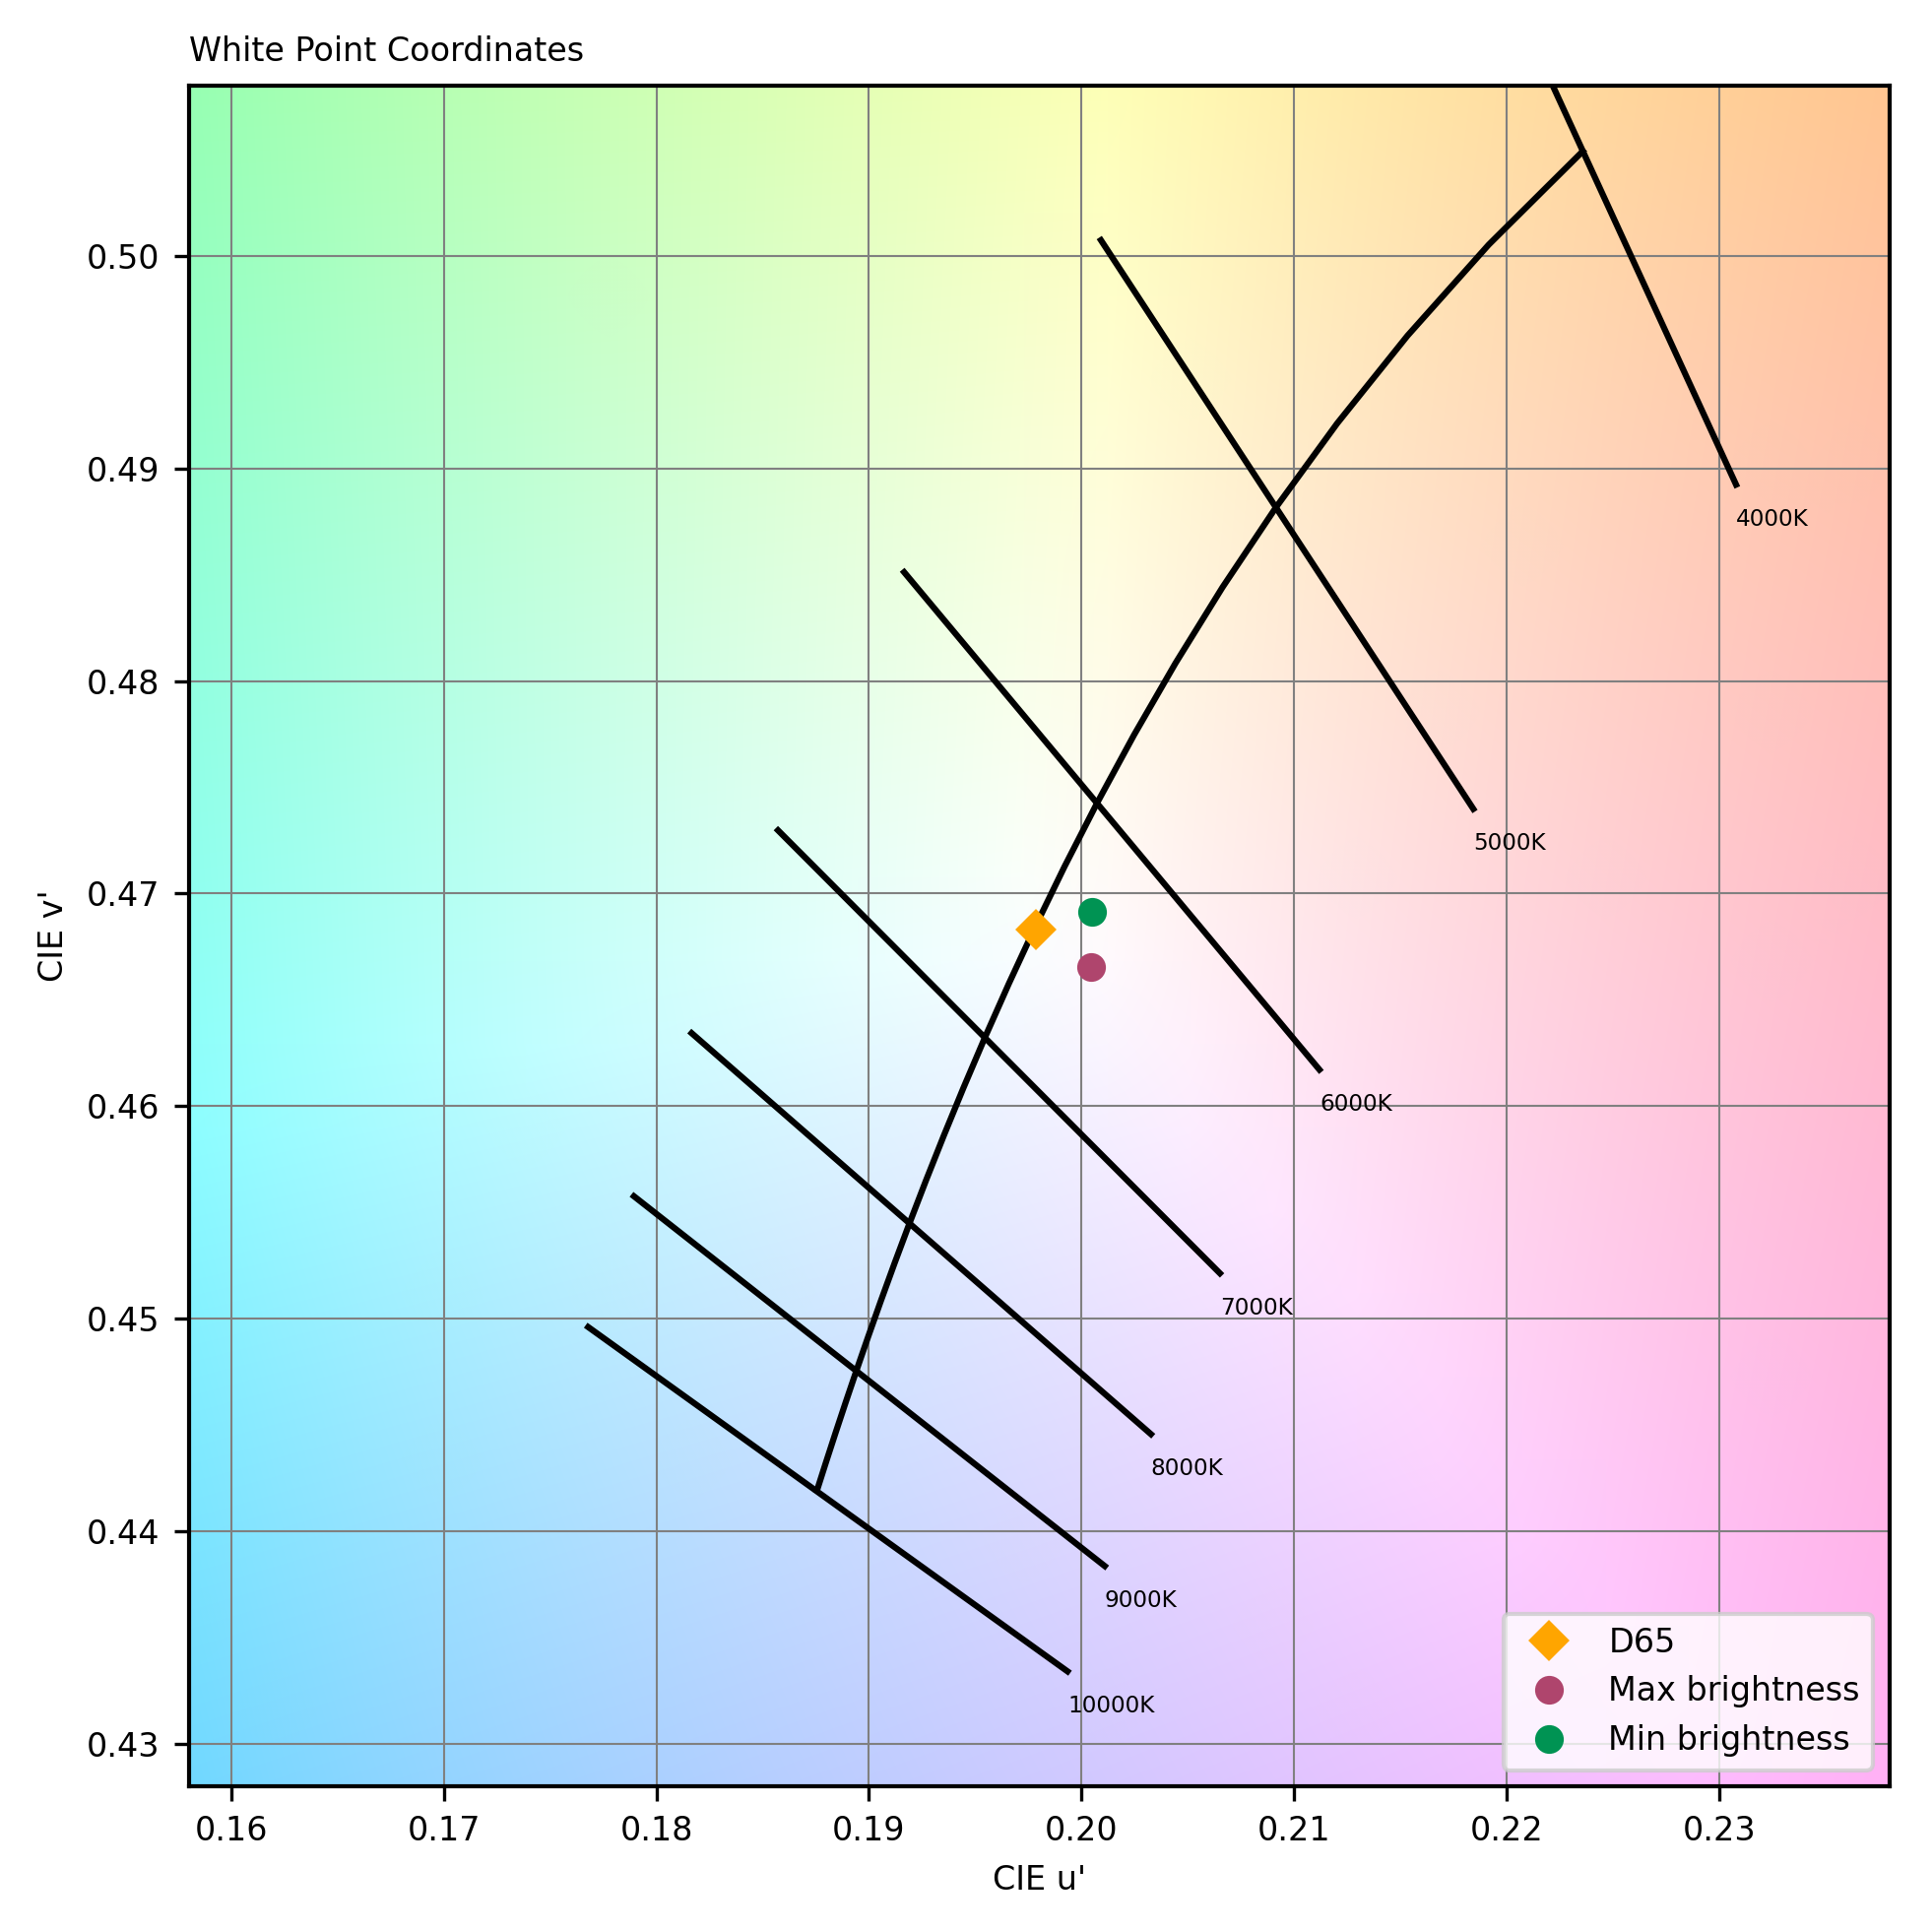
Display white point
This graph represents the color temperature of white content, compared with the reference (Daylight illuminant D65) measured in the dark on video at minimum and maximum brightness.
以下图表显示了笔记本在多媒体使用场景下的播放水平:
Audio playback scores comparison
下列图表显示了在半消声室内测得的多媒体播放的频率响应、失真和指向性:
Audio playback frequency response
A 1/12 octave frequency response graph, which measures the volume of each frequency emitted by the laptop when playing a pure-sine wave in an anechoic environment.
Audio playback Total Harmonic Distortion + Noise