苹果 iPhone 15 Pro 在 DXOMARK 摄像头 测试中表现出色,与旗舰机型 iPhone 15 Pro Max 得分相同,在我们的排名中名列前茅。
由于 15 Pro 和 Pro Max 主摄像头和芯片组采用相同的 Quad-Bayer 图像传感器,两款机型的静态图像和视频质量非常相似。然而,这两款设备使用不同的远摄摄像头,因此远摄变焦性能有所差异,也就不足为奇了。Pro Max 采用 5 倍潜望镜设计,Pro 配备了比较传统的 3 倍远摄摄像头,虽然两者在近距离上的远摄变焦性能非常相似,但 Pro 在中距离远摄方面表现更好,而 Pro Max 最适合在远距离上进行远摄拍摄。总体而言,15 Pro 在变焦类别中的得分略低于 15 Pro Max。然而,两个型号在变焦上的微小差异对总体得分没有影响,两者得分相同,因为变焦得分在我们的摄像头评分系统中权重较轻。请参阅我们的一篇文章,以深入了解摄像头基准的评分结构和公式,以及我们如何测试智能手机摄像头。
测试摘要
关于DXOMARK摄像头测试:在 DXOMARK 进行 Camera 评鉴时,我们在实验室和现实生活情境中拍摄各种各样的主题,然后根据客观测试和感知测试来进行评分。进行客观测试时,我们使用实验室环境中的测量软件直接计算测试结果;感知测试则是由一群图像专家根据一套复杂的度量标准,就需要人为判断的图像质量进行各个方面的比较。智能手机测试需要一个由工程师和技术员组成的团队进行大约一周的测试。他们分别对照片、变焦和视频质量进行评分,然后将这些分数合并为总分,以便在不同手机的摄像头之间进行比较。关于DXOMARK摄像头基准的更多信息,请点击这里。关于智能手机摄像头得分的更多细节,请点击这里。以下部分集合了我们在DXOMARK实验室进行的详尽测试和分析的主要内容。根据需求,我们可以提供更详细的性能评估报告。您可以与我们联系。
Apple iPhone 15 Pro Camera Scores vs Ultra-Premium
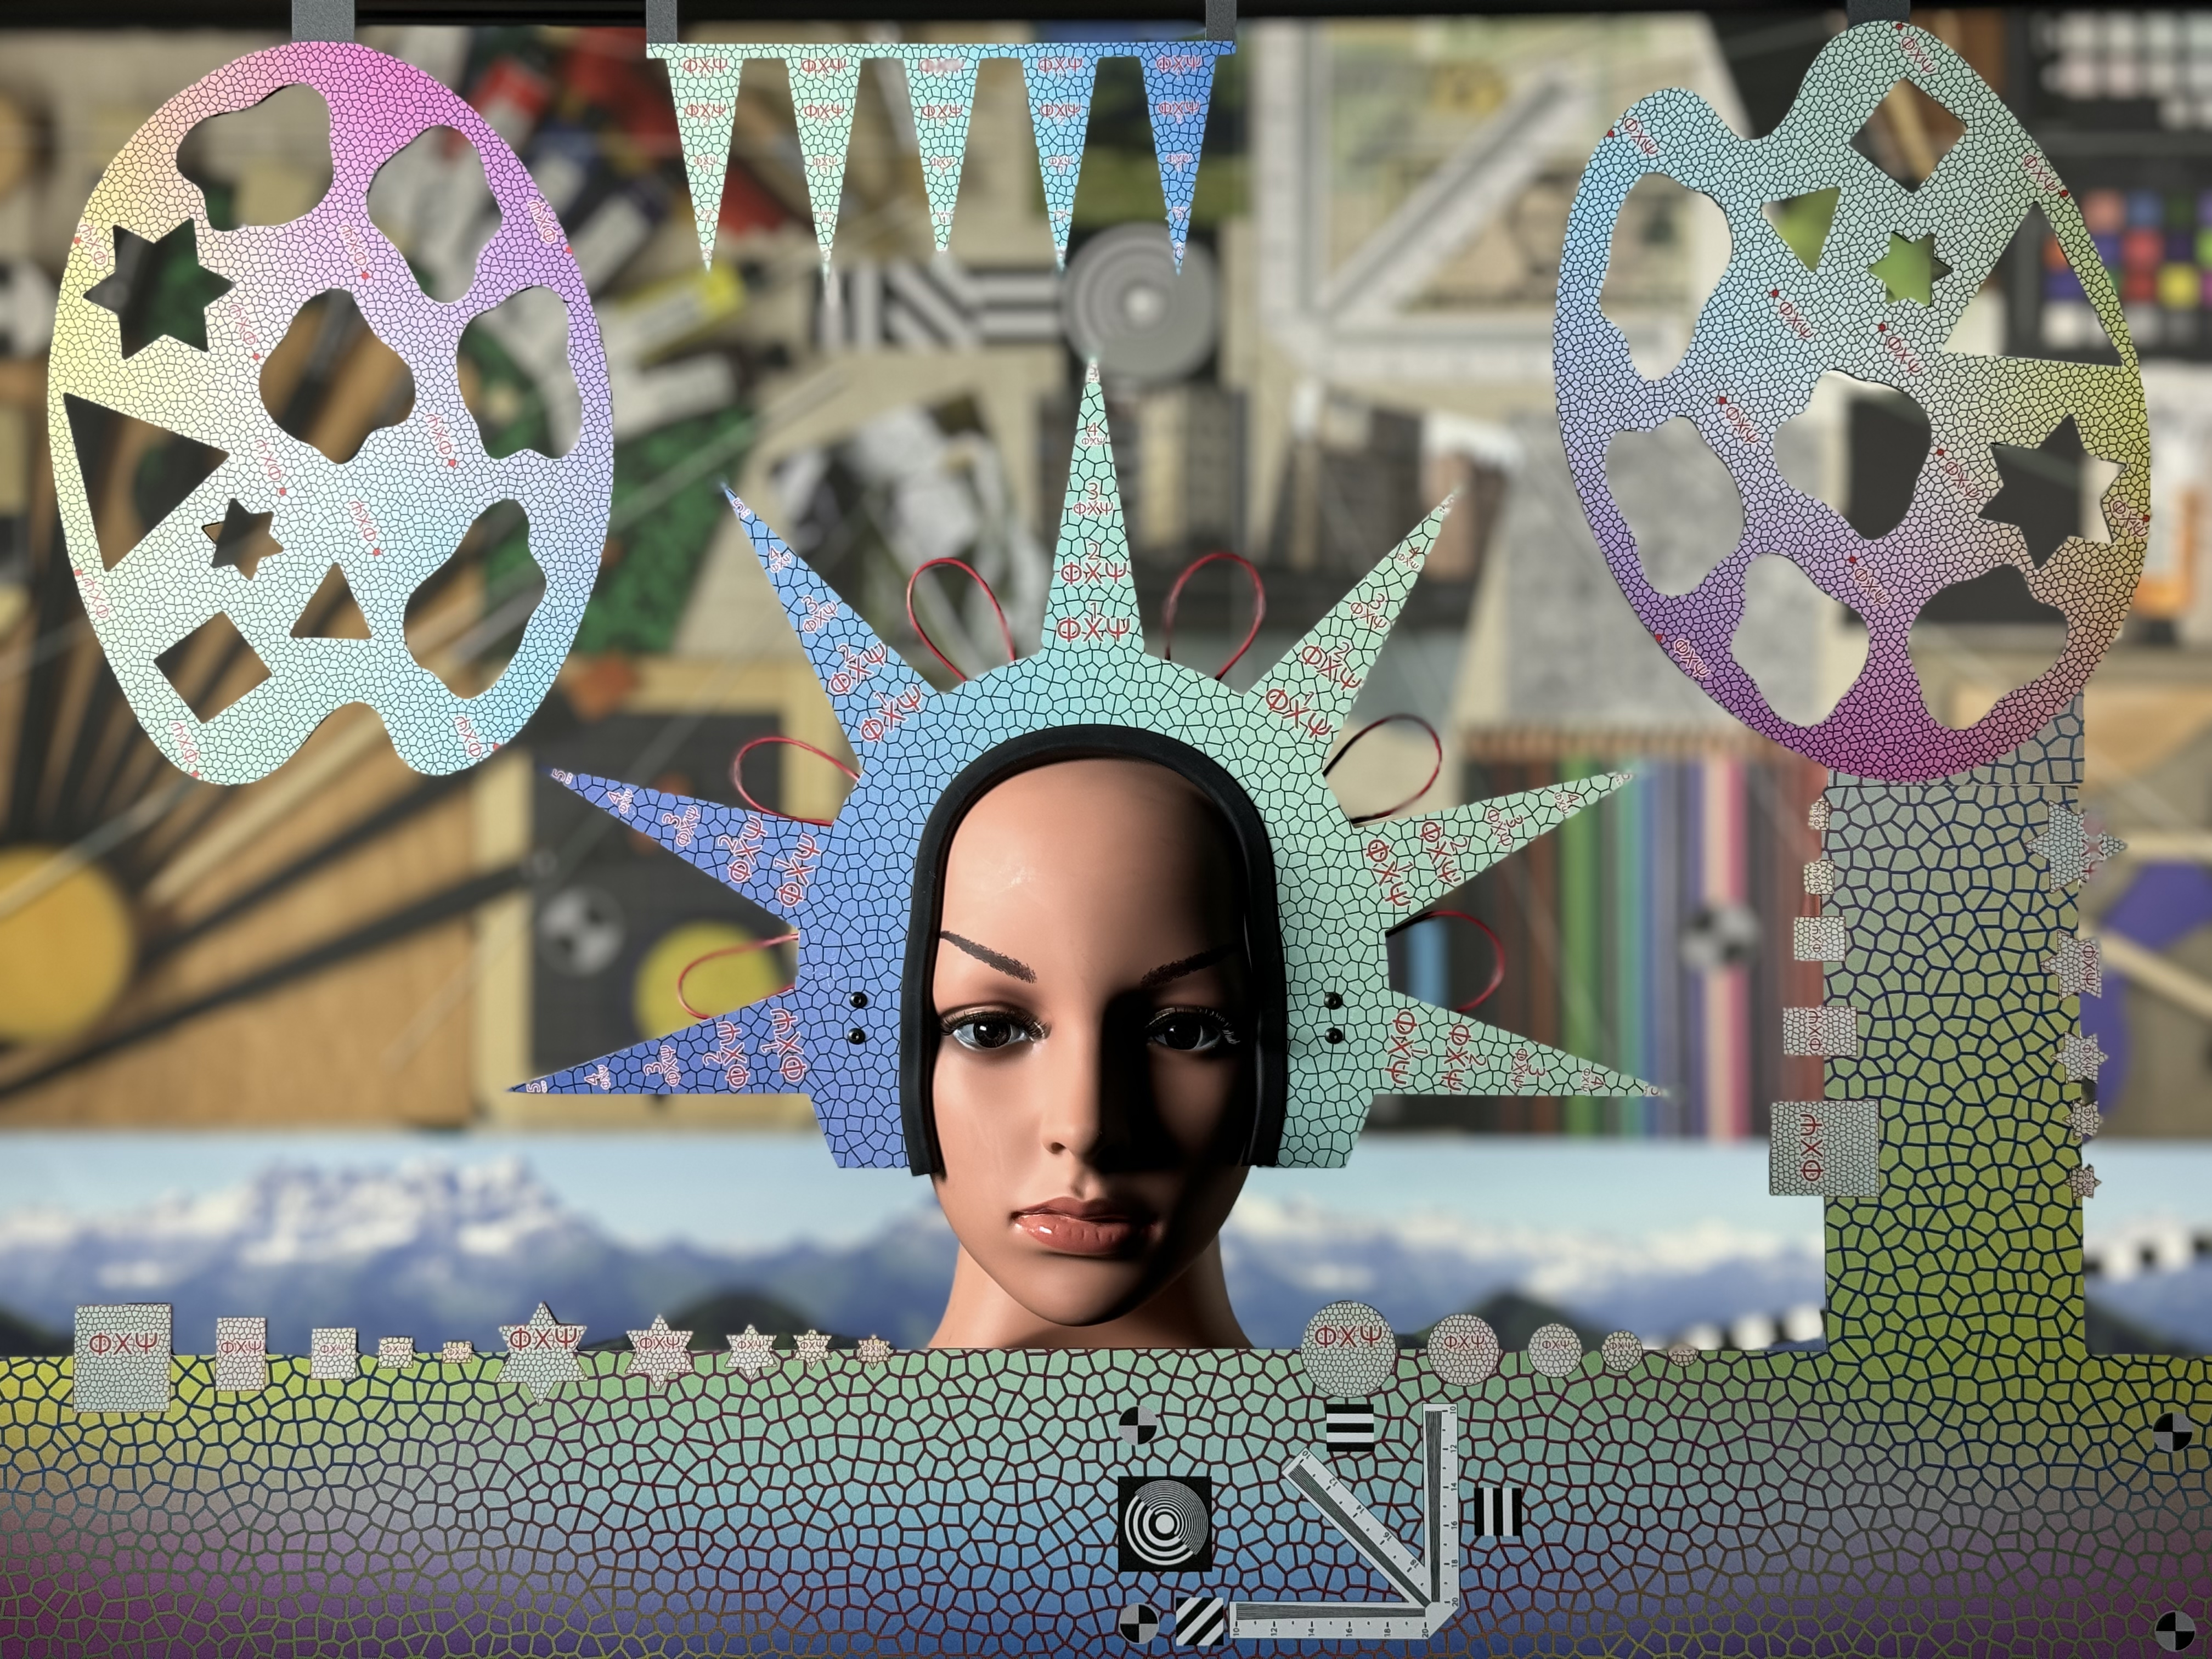
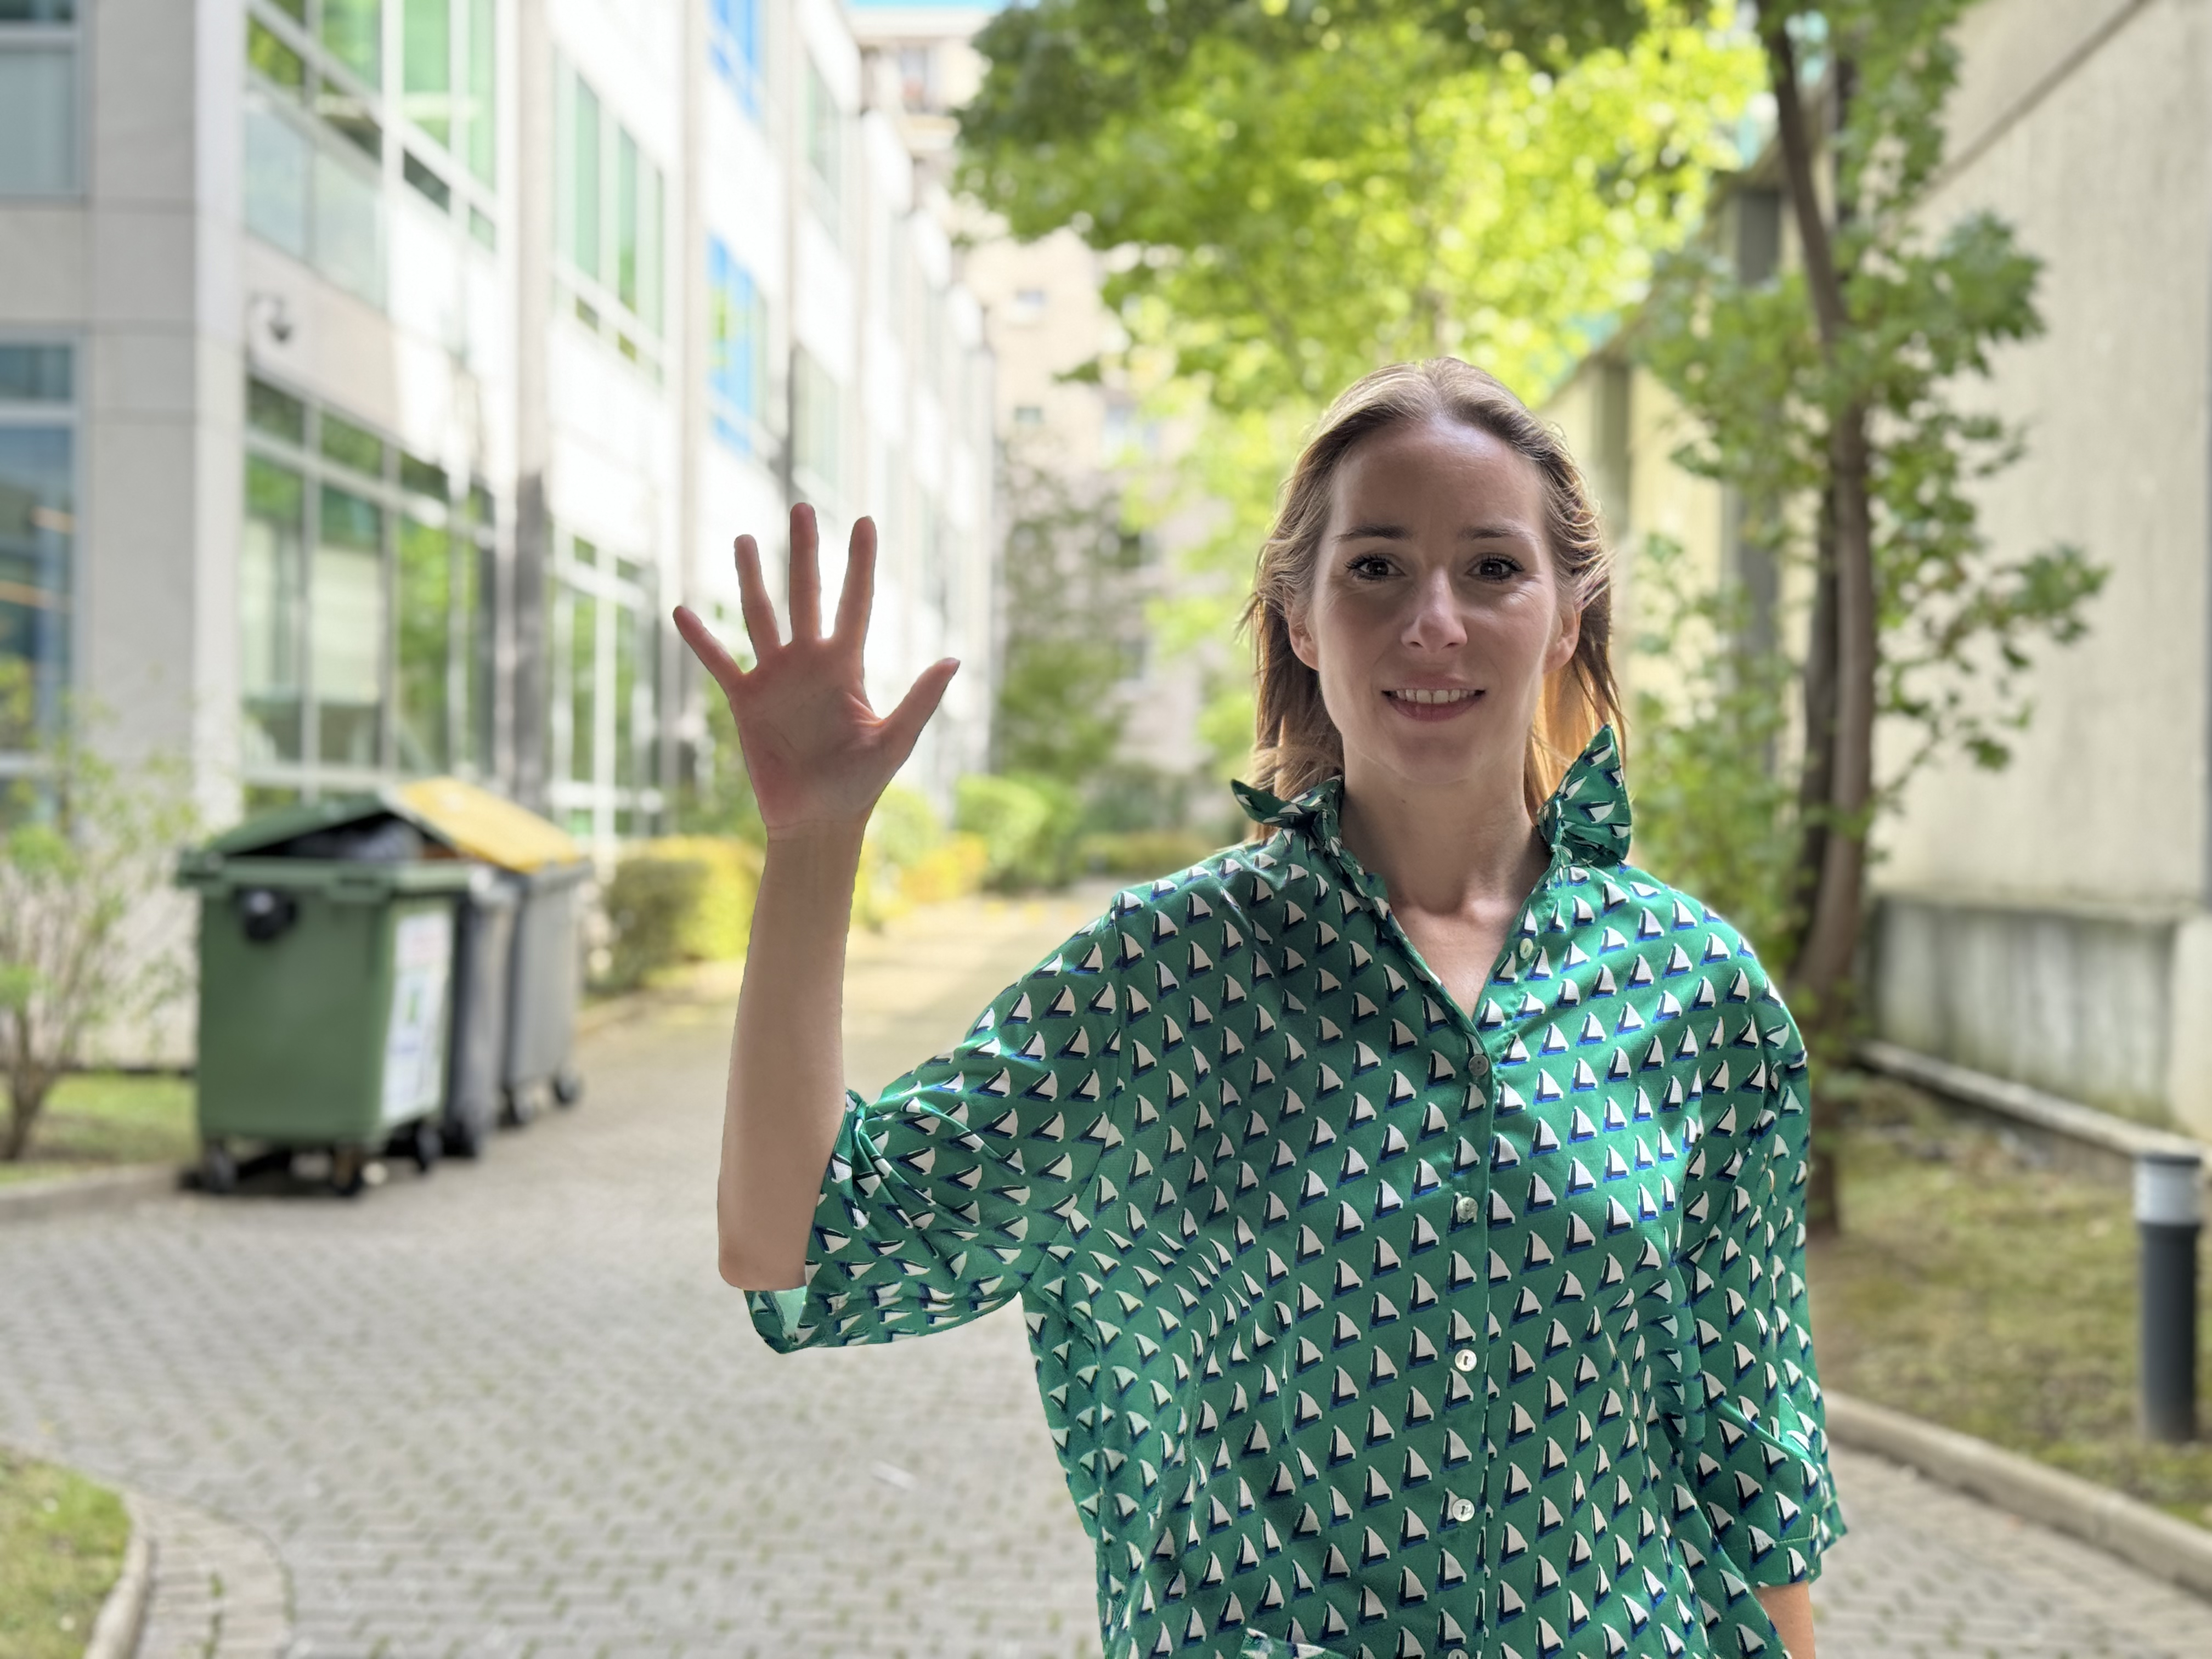
iPhone 15 Pro 在静态图像模式下的性能与我们之前在旗舰产品 15 Pro Max 上观察到的性能相当,智能 HDR 功能可提升色彩、对比度和亮度,呈现非常生动的整体图像。此外,我们的测试人员也发现摄入的细节非常丰富,尤其是在人像照片上,面部特征非常精细的细节(例如皮肤纹理和睫毛)的保留非常好。图像噪点总体上得到了很好的控制,但我们的专家在画面的暗部观察到一些亮度噪点,在低光条件下尤其如此,噪点颗粒更加明显。
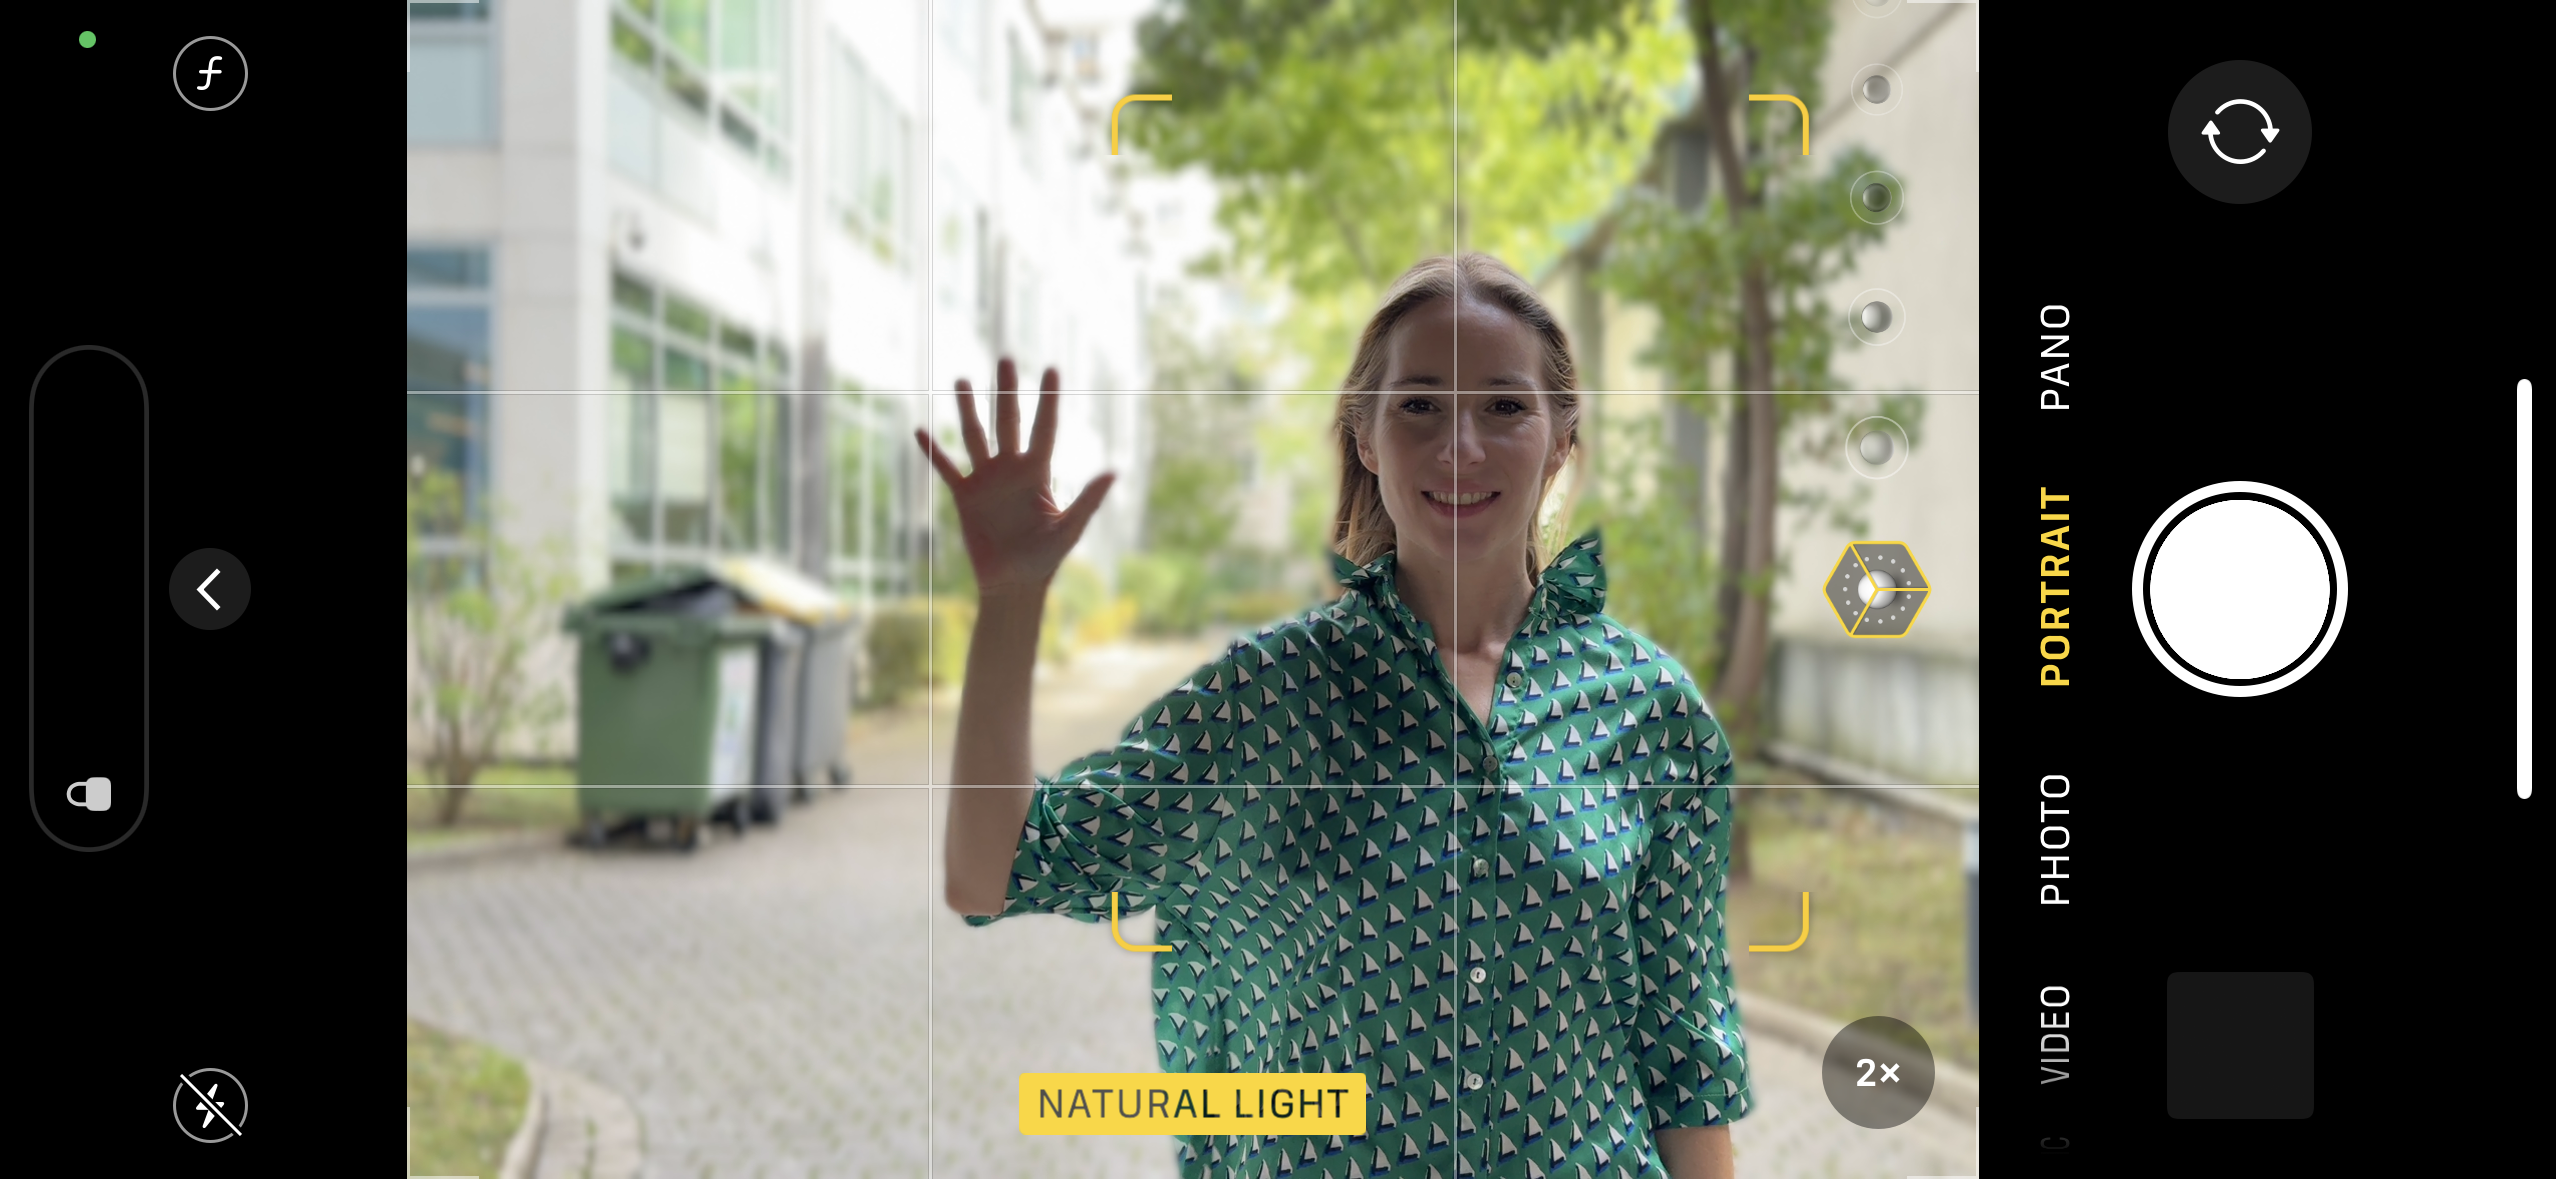
iPhone 15 Pro 的自动对焦性能基本上保持我们在前代产品上看到的水平,包括在大多数拍摄条件下的零快门时滞。这意味着该摄像头能够在按下快门的瞬间拍摄图像,从而降低错过决定性时刻的风险。
Autofocus irregularity and speed: 1000Lux Δ2EV Daylight Handheld
This graph illustrates focus accuracy and speed and also zero shutter lag capability by showing the edge acutance versus the shooting time measured on the AFHDR setup on a series of pictures. All pictures were taken at 1000Lux with Daylight illuminant, 500ms after the defocus. On this scenario, the backlit panels in the scene are set up to simulate a fairly high dynamic range: the luminance ratio between the brightest point and a 18% reflective gray patch is 2, which we denote by a Exposure Value difference of 2. The edge acutance is measured on the four edges of the Dead Leaves chart, and the shooting time is measured on the LED Universal Timer.
Autofocus irregularity and speed: 5Lux Δ0EV Tungsten Handheld
This graph illustrates focus accuracy and speed and also zero shutter lag capability by showing the edge acutance versus the shooting time measured on the AFHDR setup on a series of pictures. All pictures were taken at 5Lux with Tungsten illuminant, 500ms after the defocus. The edge acutance is measured on the four edges of the Dead Leaves chart, and the shooting time is measured on the LED Universal Timer.
DXOMARK CHART (DMC) detail preservation score vs lux levels for tripod and handheld conditions
This graph shows the evolution of the DMC detail preservation score with the level of lux, for two holding conditions. DMC detail preservation score is derived from an AI-based metric trained to evaluate texture and details rendering on a selection of crops of our DXOMARK chart.
在噪点测试中,我们分析在现实生活中和在实验室图片上拍摄的图像噪点的各种属性,例如强度、色度、颗粒和结构。就自然图像而言,我们特别注意面部、风景以及阴暗区域和高动态范围条件下的噪点。我们也会评鉴自然图像中的运动物体上的噪点。我们在 1 到 1000 勒克斯之间的各种照明条件以及不同类型的动态范围条件下对着图片进行拍摄,并对所拍摄的图像进行客观测量。我们使用枯叶图并进行标准化的测量,例如源自 ISO 15739 的视觉噪点。
Visual noise evolution with illuminance levels in handheld condition
This graph shows the evolution of visual noise metric with the level of lux in handheld condition. The visual noise metric is the mean of visual noise measurement on all patches of the Dead Leaves chart in the AFHDR setup. DXOMARK visual noise measurement is derived from ISO15739 standard.
iPhone 15 Pro 没有配备 Pro Max 的 5 倍潜望式远摄镜头,而是配备了比较传统的 3 倍远摄镜头。尽管两款手机的硬件存在差异,但在近距离观察时,两款手机都依靠主摄像头进行远摄变焦,图像质量也很相似。然而,在中距离上拍摄时,15 Pro 拍摄了更好的细节,因为 Pro Max 远摄镜头仅在 120 毫米的等效焦距上开始发挥作用。得益于其 3 倍远摄摄像头,15 Pro 还在整个远摄变焦范围内拍出了相当一致的细节水平。
DXOMARK CHART (DMC) detail preservation score per focal length
This graph shows the evolution of the DMC detail preservation score with respect to the full-frame equivalent focal length for different light conditions. The x-axis represents the equivalent focal length measured for each corresponding shooting distance and the y-axis represents the maximum details preservation metric score: higher value means better quality. Large dots correspond to zoom ratio available in the user interface of the camera application.
在近距离上观察时,iPhone 15 Pro 和 iPhone 15 Pro Max 的远摄表现相似。
苹果 iPhone 15 Pro - 近距变焦
苹果 iPhone 15 Pro - 细节良好
苹果 iPhone 15 Pro Max - 近距变焦
苹果 iPhone 15 Pro Max - 细节良好
在中距离(大约 3 倍远摄变焦倍数)上,iPhone 15 Pro 的图像效果比 Pro Max 更好。
DXOMARK CHART (DMC) detail preservation video score vs lux levels
This graph shows the evolution of the DMC detail preservation video score with the level of lux in video. DMC detail preservation score is derived from an AI-based metric trained to evaluate texture and details rendering on a selection of crops of our DXOMARK chart.
Spatial visual noise evolution with the illuminance level
This graph shows the evolution of spatial visual noise with the level of lux. Spatial visual noise is measured on the visual noise chart in the video noise setup. DXOMARK visual noise measurement is derived from ISO15739 standard.
Temporal visual noise evolution with the illuminance level
This graph shows the evolution of temporal visual noise with the level of lux. Temporal visual noise is measured on the visual noise chart in the video noise setup.